
Non-emergency responses in the 311 system during the early stage of the COVID-19 pandemic: a case study of Kansas city
 0
0 , ...
, ... Abstract
In response to the COVID-19 pandemic, many U.S. citizens sought information and support from their city governance through the 311 non-emergency service request system. The main purpose of this study was to analyze the temporal trends in the 311 data before and during the first few months of the COVID-19 pandemic (3/1/2019 to 9/1/2020). Like other major U.S. cities such as Dallas and New York City, analysis of Kansas City 311 data showed that the COVID-19 pandemic has led to a considerable decline in the aggregate number of calls. However, five service categories (“Public Safety”, “Public Health”, “Trash/Recycling”, “Parks & Recreation”, and “Property/Buildings/Construction”) experienced a substantial increase in call volume. To explore whether these changes are driven by COVID-related service requests, we used the description text data and identified 2,379 requests related to the pandemic, accounting for 4.3% of all non-emergency requests in Kansas City between March and August 2020. More than half of the COVID-related requests reported mask violations, where people failed to wear masks or did not wear masks properly. Compared to the non-COVID-related requests, citizens were more likely to seek non-emergency services through phone and email and less likely to use the web as means of communication. In addition, most changes in “Public Safety” and “Public Health” request volumes were driven by these COVID-related requests. These results can help city officials and decision makers improve the city’s resilience by allocating resources for the abovementioned five service categories during a pandemic. In conclusion, early-stage analysis of open-access 311 data can be a catalyst for local governments to quickly and properly respond and build long-term resilience against future pandemics and other health threats.
Keywords
INTRODUCTION
The 311 system is a non-emergency response system where people can make a request to find information about services, make complaints, or report non-emergency problems, such as potholes and trash collection. The system was initially designed to reduce call volume on the overloaded 911 system, allowing it to be reserved for official police business[1]. In recent years, 311 request systems have become an integral part of the e-government movement in which technological innovations are deployed to help local governments deliver more efficient and effective services to residents[2-4]. The system is not only useful in reactive perspectives but can also be used in a proactive manner, such as being merged with other disparate data sources to develop predictive models of service needs[5].
While the 311 systems are not designed for crisis response, they have shown the potential to efficiently help local governments serve residents in the face of unexpected events or dramatic shocks to the system. Some jurisdictions have used 311 systems to communicate with residents, as well as anticipate the need for resource allocations based on initial reports and predictive models[6]. Cities have also monitored calls to flag such events and support the deployment of messaging out to residents about emergencies and responses[7]. The 311 systems have been used to develop responses to hurricanes, tornadoes, and other natural disasters, including warning residents and deploying rapid response systems[8]. With respect to unexpected man-made events, 311 systems have been used to support citizen needs and monitor activity levels. For example, during the transit strike in New York City, the number of calls and response times varied significantly from pre and post-strike levels[9].
During the COVID-19 pandemic, the 311 systems were put to the test of resilience and efficiency, where the pandemic caused several disruptions. Four months after the first case of COVID-19 in Wuhan, China, the World Health Organization (WHO) declared COVID-19 a pandemic with more than 2 million confirmed cases and thousands of deaths around the globe[10]. In the same month, the U.S. declared a national emergency and many states issued mandatory stay-at-home orders, imposed social distancing regulations, and banned large gatherings, resulting in nationwide elementary and high school closures[11-13]. In addition, the pandemic caused major disruptions across industries and their supply chains, particularly in influenza, healthcare, and food, which are critical products that require a resilient and sustainable supply during times of crisis[14-16]. At this early stage of the COVID-19 pandemic, citizens were faced with a pressing health crisis, strict mandates, economic impact, and shortages of personal protective equipment and diagnostic testing. It is in situations like this when public guidance plays an important role as it significantly affects individual risk perception and the effective implementation of public health strategies and measures to control COVID-19[17-19]. The 311 systems can become a resilient component of providing public guidance, accurate local information, and essential non-emergency service to its citizens.
The main objective of this study is to determine if the statistical and text analysis of 311 data can be used as a tool for identifying changes in demand for city services in the case of a global pandemic. If successful, it can be used as a framework to improve resilience and crisis response strategies. There are a few studies on the patterns of 311 systems during COVID-19, focusing mainly on New York City, Dallas, and Orange County[20,21]. In New York City, the 311 systems added specific categories and descriptors for calls related to the pandemic, which greatly helped capture the reaction of its citizen to the crisis and associated responses taken by the municipality agencies. Lieberman-Cribbin et al., documented the increase in a spike in cumulative calls and covid-related calls in New York City, most of which were placed to get more information on the coronavirus, its symptoms, prevention measures, and testing locations[20]. In addition, Eugene et al., also reported a 71% increase in school-related calls during 2020, reflecting the concerns of its residents on the updated schooling plans for the Fall[21]. Furthermore, Pamukcu et al., found declines in requests for street condition, blocked driveway, and illegal parking and spikes in noise complaints and non-emergency police matters[22]. These studies showed that the 311 system can be utilized to understand the impact of COVID-19 on the community as well as its additional covid-related categories providing new insights into the existing crisis. Florida added new 311 categories related to the pandemic (PPE for Small Biz, PPE for Houses of Worship, Orange CARES, COVID-19 Rental Assistance) under the Public Safety category, where Pamukcu et al., found 92% of the public safety calls between January and October 2020 were related to COVID-19 information requests[23]. They also identified pandemic-specific calls using the detailed description of each service request and confirmed that most of these requests were information requests assigned to the Public Safety category. Unlike findings for New York City, the Dallas 311 data showed reduced noise complaints during the COVID-19 timeframe by about 14% compared to the pre-COVID-19 period, especially in and around the city center[24].
In this paper, we first identify the existing patterns in the Kansas City, Missouri 311 data during and before the COVID-19 pandemic. Then we explore how the crisis response during the early stage of the pandemic was reflected in the 311 non-emergency service requests. The Kansas City 311 data showed that the COVID-19 pandemic has led to a considerable decline in the aggregate number of calls. However, five service categories, “Public Safety”, “Public Health”, “Trash/Recycling”, “Parks & Recreation”, and “Property/Buildings/Construction”, experienced a substantial increase in call volume. Since there is no indicator or category for pandemic-specific requests, we designed a framework to identify COVID-related calls based on the description of each request. This identification allowed us to distinguish changes driven by covid-related service requests. There were 2,379 requests related to the pandemic, accounting for 4.3% of all non-emergency requests in Kansas City between March and August 2020. More than half of COVID-related requests reported mask violations where people failed to wear or did not wear masks properly. Compared to non-COVID-related requests, citizens were more likely to seek non-emergency services through phone and email and less likely to use the web as means of communication. Since there were no changes in access to the web, this may suggest an expansion of citizens drawn to the 311 system and an increase in community engagement. In addition, most changes in “Public Safety” and “Public Health” request volumes were driven by these covid-related requests. The outcomes of this study can identify the course of actions that must be taken by the local governments to better help the citizens at the early stage of a natural disaster or a pandemic.
The present work increases our understanding of the crisis response patterns in the 311 systems during COVID-19 in two regards. First, the different trends between New York City and Dallas show that citizen responses during the pandemic captured in the 311 systems are not spatially homogenous. Thus, our analysis of Kansas City 311 data brings insights to build a more comprehensive model of pandemic response in the 311 systems across U.S. cities. Second, the New York City and Florida literature showed that the proactive decision to categorize COVID-related requests in the 311 systems during the pandemic can bring immediate and valuable information to both municipality and its residents. However, many cities did not identify whether a request was related to COVID-19, including Kansas City. Here, we showed that text mining tools can be applied to the text descriptions of the 311 requests to identify patterns in COVID-related requests. This can assist researchers in exploring crisis response patterns in the 311 systems during a pandemic.
The rest of this paper is structured as follows. Section “METHODS” describes our 311 data and how we identified covid-related requests. Section “RESULTS” provides the main findings of the paper and Section “DISCUSSION” discusses the strength and limitations of our methods and findings.
METHODS
Data
The 311 service request data came from the Kansas City Open Data website (3/1/2019 to 9/1/2020) recording non-emergency calls across Jackson, Clay, Platte, and Cass counties in the Kansas City, Missouri area (KCMO). The data contained the date the request was made, the date it was completed, the category it belonged to, whether it was made via phone or email or other methods, and a brief description of each request.
Identification of covid-related requests
Requests related to COVID-19 were identified by searching for keywords in the description of the request. There were 20 keywords related to the pandemic and the policy response to fight the pandemic, including the stay at home orders, mask mandates, and social distancing measures: “covid”, “corona”, “pandemic”, “virus”, “positive”, “mask”, “face cover”, “coverings”, “ppe”, “social”, “distanc”, “6 feet”, “quarantine”, “stay at home”, “gathering”, “essential”, “still open”, “open for business”, “open and operating”, and “still operating”. We examined the number of requests containing each keyword over time, before and during COVID-19, to ascertain whether the identified requests are pandemic-related as shown in Figure 1. If a keyword is associated with the pandemic and is only mentioned in the request during the pandemic with no mentions in the request pre-pandemic, this keyword is likely to accurately identify covid-related requests in the 311 system. Thus, we looked for keywords whose number of requests was few to none before the pandemic and spiked during COVID-19. There are many keywords that did not pass this check despite being related to the pandemic. This resulted in 2,379 calls identified to be associated with COVID-19.
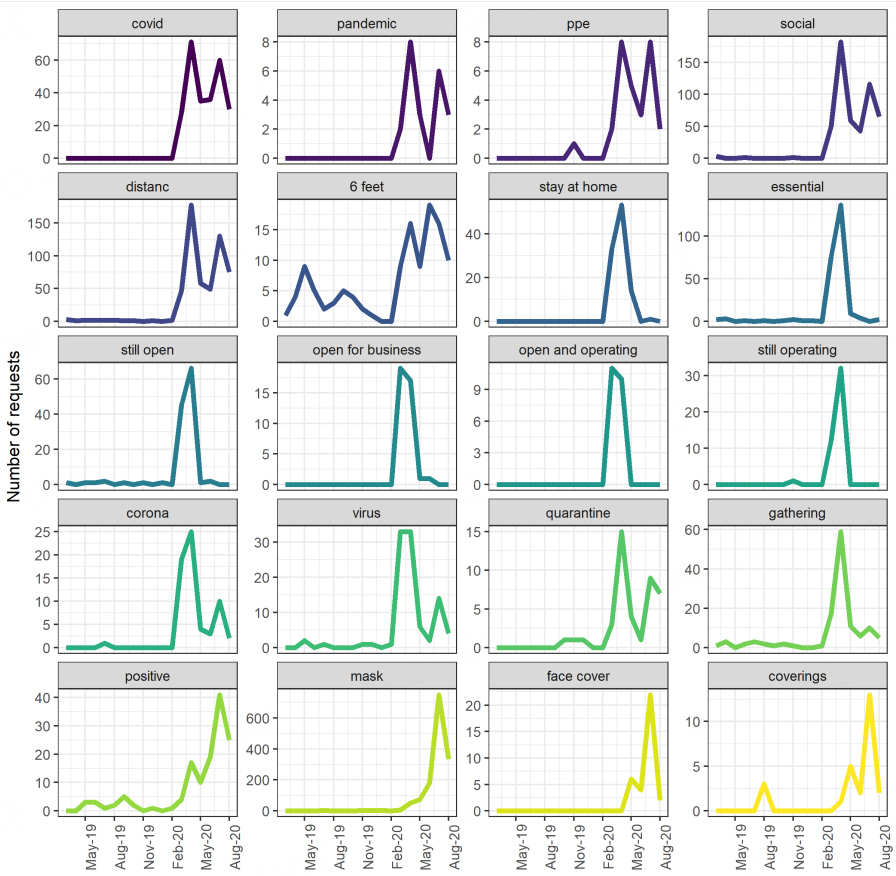
Figure 1. Monthly number of requests containing COVID-19-related keywords in 2019-2020.
Figure 1 also shows that the keywords follow three main pattern groups in the early stage of the pandemic. The first group contains “covid”, “pandemic”, “ppe”, “social”, “distance”, and “6 feet” with two peaks in April and July. The second group comprises “stay at home”, “essential”, “still open”, “open for business”, “open and operating”, “still operating”, “corona”, “virus”, “quarantine”, and “gathering” with only one main peak in April. This is in line with the policy implemented to control COVID-19, which imposed a strict stay-at-home order to stop the spread of the novel coronavirus that prohibited large gatherings and only allowed essential businesses to operate. The last group includes “positive”, “mask”, “face cover”, and “coverings” with only one main peak in July, which is likely in association with mask mandates put in place to help curb the spread of the coronavirus as recommended by both the Centers for Disease Control and Prevention and World Health Organization. In addition, the volume of the requests by each keyword also showed that “mask” is of the most concern among COVID-related requests, followed by “social” and “distance”.
RESULTS
Trends in 311 non-emergency responses
We compared the cumulative request volume of the March-August period in 2020 to its previous year and found a drop of 13%, falling from 64,351 service requests to 56,014 requests during the early stage of the pandemic. Most of the decline in the number of requests occurred in the first three months of the season as shown in Figure 2. In March, the number of calls fell from 11,204 requests pre-pandemic to 9,273 requests during the pandemic, a decline of 17%. The largest drop took place in April, going from 11,762 calls in 2019 to 8,122 calls in 2020, equating to a 31% drop in the total number of calls. In May, the number of calls continued to fall by 21% compared to the pre-pandemic period. This gap quickly narrowed in the latter three months of the season, where the number of calls was within 10% of observations from the previous year.
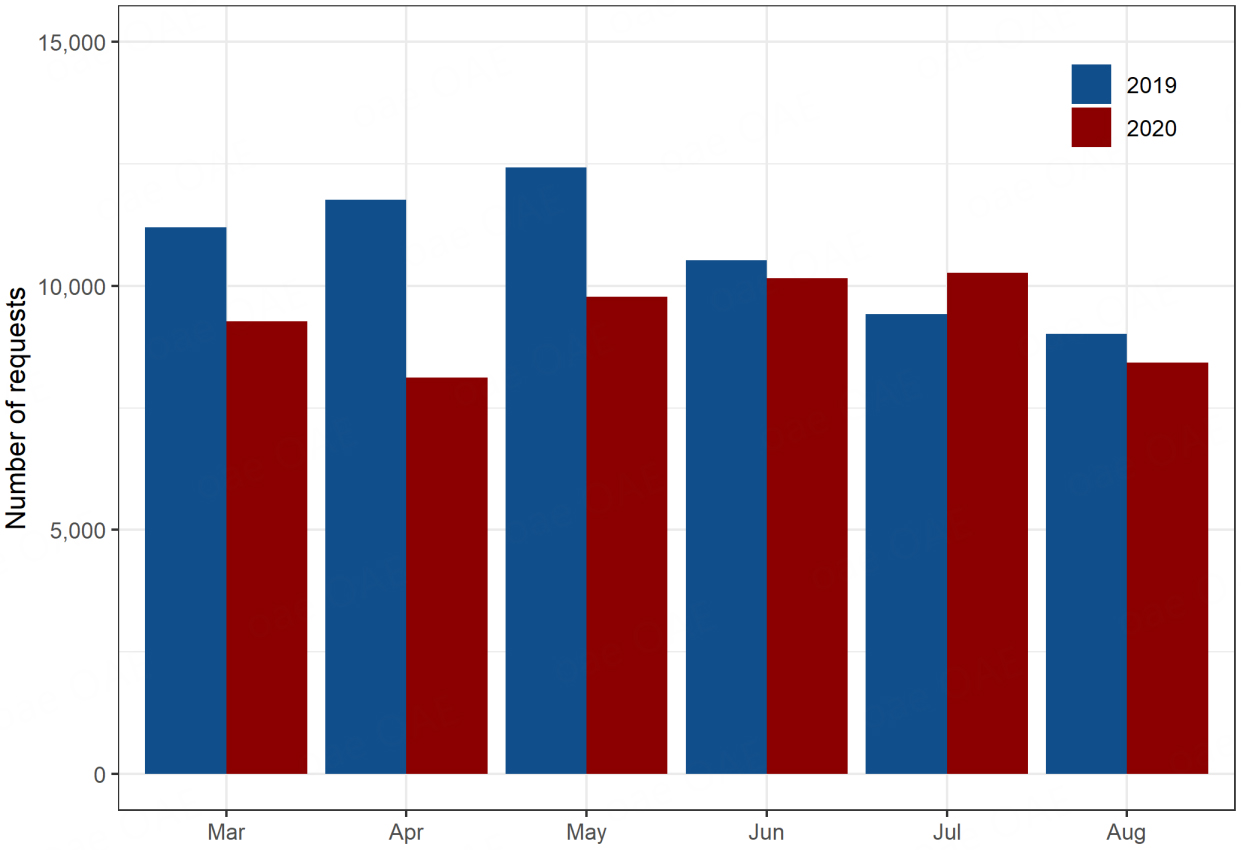
Figure 2. The number of requests during March-August in 2019 vs. January-August 2020.
However, the large decline in call volume at the early stage of the pandemic was not universal across request types. We then compared the difference in cumulative request volume of the March-August period between 2019 and 2020 for each type of service requested. Table 1 provides all 15 types of services ranked from the largest (most positive) percentage change to the smallest (most negative) percentage change with their cumulative number of requests before and during the pandemic. We excluded requests whose type of service is “Data Not Available”.
The number of requests during March-August 2019 vs. March-August 2020 by type of services
| Type of service | Number of requests pre-pandemic | Number of requests during the pandemic | Percentage change (%) |
| Public safety | 186 | 649 | 248.9 |
| Public health | 1,372 | 4,077 | 197.2 |
| Trash/Recycling | 16,170 | 19,988 | 23.6 |
| Parks & recreation | 803 | 886 | 10.3 |
| Property/Buildings/Construction | 7,244 | 7,859 | 8.5 |
| City facilities | 29 | 29 | 0.0 |
| Lights/Signals | 2,554 | 2,372 | -7.1 |
| Sidewalks/Curbs/Ditch | 1,308 | 1,156 | -11.6 |
| Signs | 1,611 | 1,326 | -17.7 |
| Government | 442 | 352 | -20.4 |
| Capital projects | 757 | 595 | -21.4 |
| Storm water/sewer | 4,031 | 3,088 | -23.4 |
| Mowing/Weeds | 4,262 | 3,007 | -29.4 |
| Animals/Pets | 6,928 | 4,357 | -37.1 |
| Streets/Roadways/Alleys | 16,648 | 6,255 | -62.4 |
Changes in call volume vastly differ from one category to another. Table 1 shows that five service categories received more requests during the pandemic (first five rows), one category, “City Facilities” had no changes, and the remaining nine categories received fewer calls when the pandemic hit (the bottom nine rows). Categories with declines in call volume account for 60% of total call volume pre-pandemic but only 40% of total call volume during the pandemic. It is the largest category, “Streets/Roadways/Alleys”, that also experienced the largest drop from 16,648 requests in the March-August period in 2019 to 6,255 requests in the March-August period in 2020, corresponding to a decline of 62.4%. Other than “Government” and “Capital Projects”, all the remaining categories are related to street conditions, such as “Lights/Signals”, “Sidewalks/Curbs/Ditch”, and “Mowing/Weeds”. The decline in these categories parallels the decrease in mobility and traffic as the stay-at-home orders took place and people were moved to work from home. This suggests that from an administrative perspective, it is important to train the city employees in a way that they can switch from one task (e.g., maintenance and repair of all public streets) to another (e.g., protecting against environmental health hazards).
Of the top five categories, “Public Safety” and “Public Health” experienced the largest increases in call volume during the early stage of the pandemic as the number of requests for “Public Safety” increased by 2.5 times and the number of requests for “Public Health” also doubled. This is an important result for measuring the number of resources needed to respond properly to a pandemic. As these categories did not have any large call volume initially, their surge in requests was not enough to offset the declines in the aggregate trends. Though the call volume for “Trash/Recycling” did not double like “Public Safety'' and “Public health”, it had a significant increase of almost four thousand requests, corresponding to 23.6%. It is followed by “Parks & Recreation” and “Property/Buildings/Construction” with increases of 10.3% and 8.5%, respectively.
While trends of 311 request volume in the early stage of the pandemic are useful and informative, there are significant events other than COVID-19 that took place in 2020, confounding whether the trends reflect non-emergency responses due to the COVID-19 health crisis or other events at the time. For example, we have learned that the call volume for “Public Safety” substantially increased by many folds, but we have yet to investigate how much of the increase is driven by covid-related requests, such as calls about lack of social distancing or violations of masks mandate, or by non-covid related requests, such as the civil unrest against systemic racism and the increase in time spent at home.
COVID-related requests in the 311 system
Since there was no indicator or category for pandemic-specific requests in Kansas City, we used the description for request for identification and found 2,379 requests related to the pandemic, accounting for 4.3% of all non-emergency requests in Kansas City between March and August 2020. The 311 system started receiving COVID-related requests in March 2020 and experienced a peak of more than 500 calls in April and another peak of more than 750 calls in July of the same year. There is also an increasing trend in the volume of pandemic-specific calls. We explored whether this trend is related to the severity of the pandemic, for which we used the 7-day moving average of the number of COVID-19 new cases and the number of COVID-19 total cases in Kansas City, Missouri at the time as a proxy[25]. Figure 3 shows that these trends for covid-related requests aligned with the trends in the average number of new cases at the time. In addition, the trend is also reflected in the proportions of requests related to the pandemic, suggesting that it is not driven by the volume of all non-emergency calls. In particular, the share of pandemic-related calls was 2.1% in March, then peaked in April at 6.4%, came down to 1.8% and 2.5% in May and June, but peaked again in July at 8.3%.
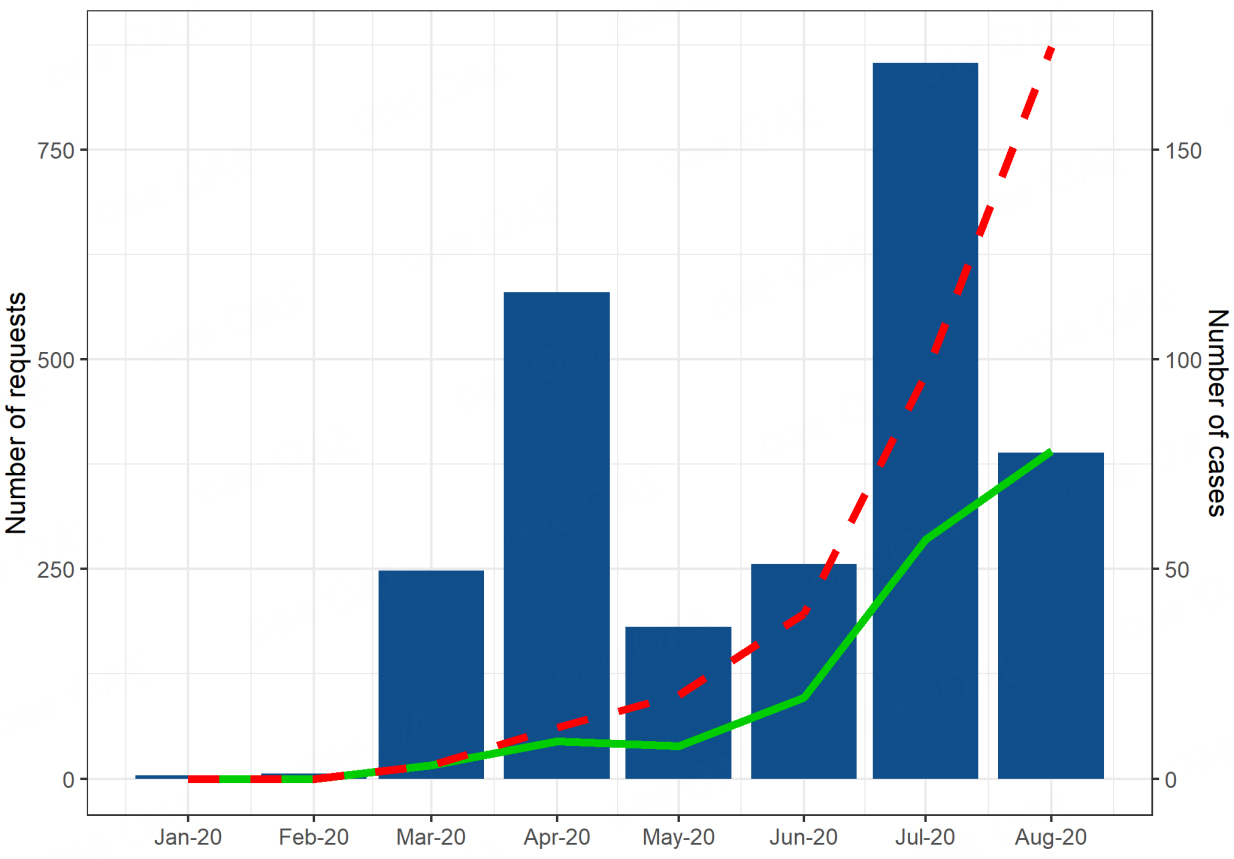
Figure 3. The number of covid-related requests (blue, left axis) vs. COVID-19 new cases (green line, right axis) and COVID-19 total cases (dashed red line, right axis) in 2020.
Covid-related calls reflect citizens’ responses to the crisis of the pandemic and pandemic-related policies, including but not limited to the stay-at-home order, the social distancing rules, and the mask mandates. More than half of covid-related requests contained text about mask violations where people fail to wear masks or do not wear masks properly. Some examples of these requests are “No Employees were wearing masks while helping customers” or “Staff not enforcing the use of masks”. About a third of covid-related requests reported instances of social distancing violations where people do not maintain six feet distance from one another or hold large gatherings in enclosed spaces. For example, one request reported “Citizen is reporting there was no social distancing taking place in the outside eating area”. There are about four hundred COVID-related requests reporting positive cases and failure to quarantine, such as “They have had two positive cases and have not sanitized/disinfected areas. They did not have staff members quarantined”. Another major text mentioned is essential business, where almost 10% of COVID-related calls reported the violation of opening a non-essential business during the stay-at-home order. An instance reported “[Business entity] has continued to operate a non-essential business during the stay-at-home order”. It is important to note that a covid-related request can reflect multiple violations at the same time. For example, a request reported that people failed to wear masks properly and socially distanced themselves, “No social distancing, very crowded. All staff wearing masks under nose”.
We further investigated how these different topics are interconnected and highlighted using word association graphs based on the description text of covid-related quests [Figure 4]. The texts were cleaned, tokenized, stemmed with stop words removed, and limited to bigrams that were mentioned more than 20 times. Each word is a node and the relationship between two words are represented with an edge. The transparency and width of the edge are accentuated based on the relationship between words. The more time a combination of two words is mentioned in the description of a covid-related request, the bolder and wider the edge between them is. Figure 4 shows that wearing masks (wear, mask) is of the most concern among covid-related requests, which also has many ties to mandate-related words such as policy, mandate, rule, ordinance, enforce, and require. Mask was mentioned in association with the large gatherings (people, 10, 20, inside) and positive test (employee, test, positive). Another major concern among covid-related requests highlighted in the word association graph is social distancing (social, distance, guideline, practice), which stands independent from the word cluster surrounding mask.
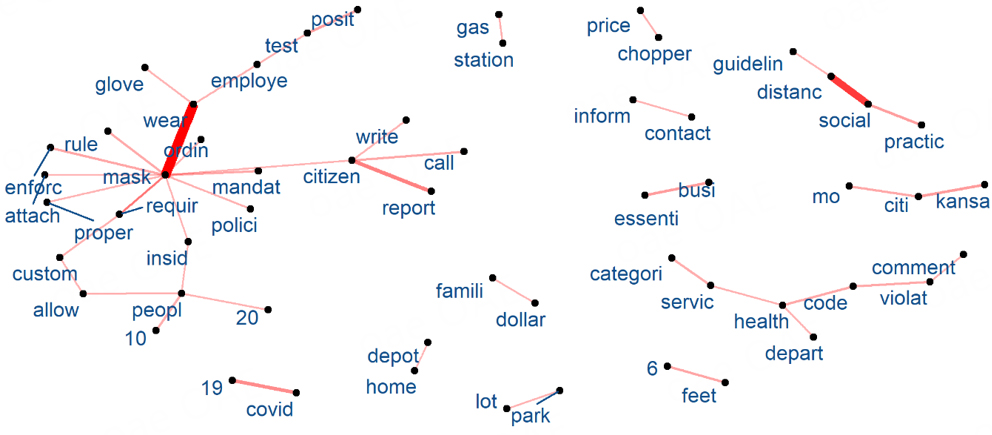
Figure 4. Words association graph for the description text of all COVID-related requests. The transparency and width of the edge vary based on the strength of the relationship between words. The more time a combination of two words is mentioned in the description of a covid-related request, the bolder and wider the edge between them is.
In addition, it is also imperative to ascertain that citizens have access to the 311 systems during crises caused by natural disasters or pandemics. While there are numerous methods to submit a request, phone, web, and email remain the most common methods for outreach, accounting for almost 90% of all non-emergency requests between March and August of 2020. Thus, we focused on the usage of these methods among covid-related calls compared to non-covid-related calls to identify important means of communication in crisis response during COVID-19. Table 2 shows that people relied more on phone and email for covid-related requests compared to non-covid-related requests. As noted, 63.1% of all COVID-related requests were made via phone, 5.3% higher than that of non-COVID-related requests. More dramatically, the share of covid-related requests made through email was twice the share of non-COVID-related requests made through email. On the other hand, the web was a less common method used among covid-related requests at 19% compared to non-covid-related requests at 22.7%.
Comparing covid-related requests to non-covid related requests by sources during March-August in 2020
| Covid-related requests (%) | Non-covid-related requests (%) | All requests (%) | |
| 16.3 | 9.0 | 9.3 | |
| Web | 19.0 | 22.7 | 22.6 |
| Phone | 63.1 | 57.8 | 58.0 |
The role of covid-related requests in aggregate trends
Since COVID-related requests only accounted for less than 5% of all non-emergency services, their influx had minimal impact on the declining trend of the aggregate volume in the 311 systems during the early stage of the pandemic. However, there were five categories, “Public Safety'', “Public health”, “Parks & Recreation”, “Property/Buildings/Construction”, and “Trash/Recycling”, that experienced a surge in volume. We investigated whether COVID-related requests can be the driver behind these volume increases by looking at the monthly year-over-year change in call volume from March through August of 2020 for a category and the monthly volume of covid-related requests in that category during the same time period.
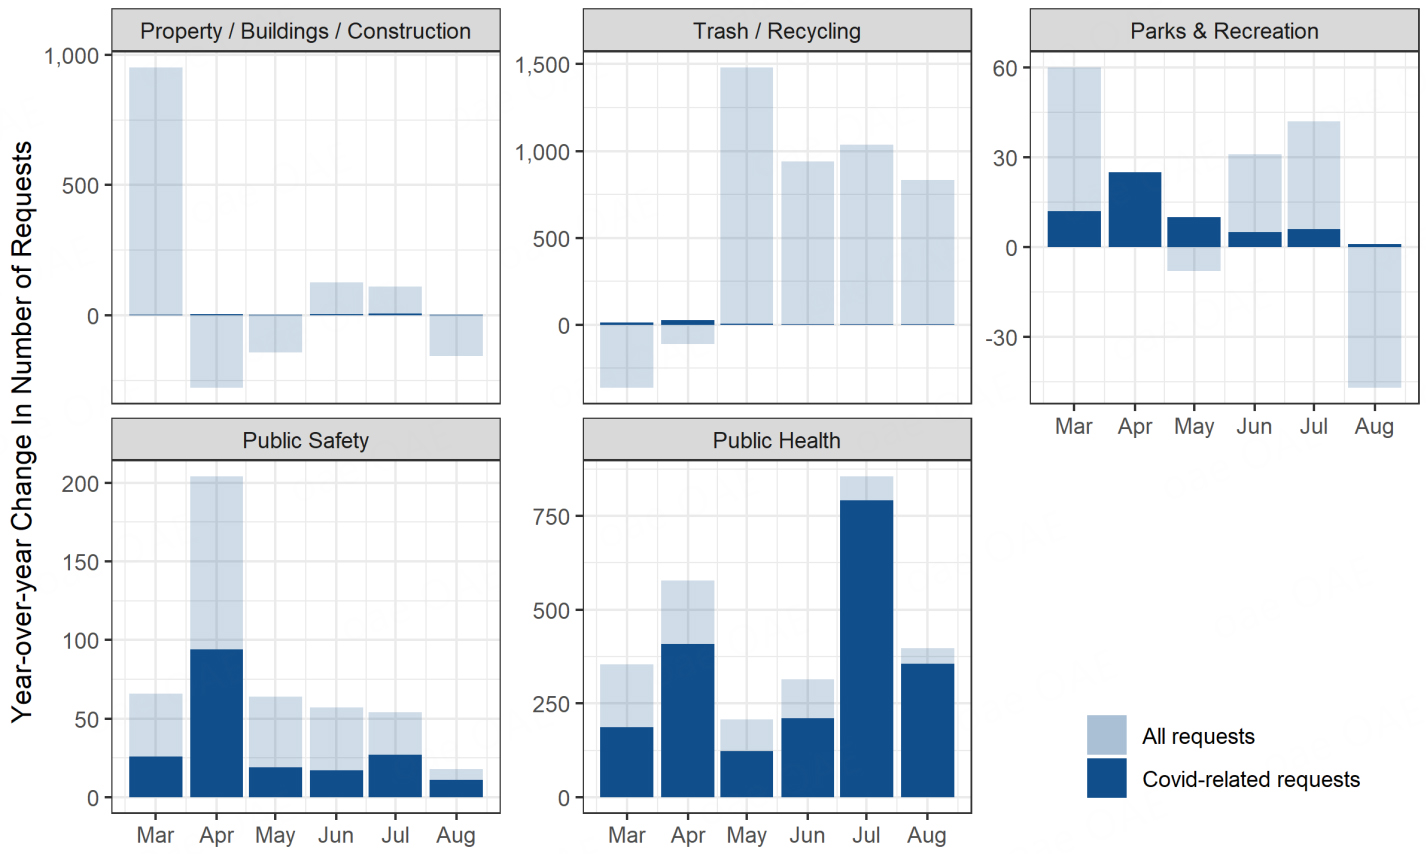
Figure 5. Monthly year-over-year change in call volume from March through August of 2020 for a category (lighter blue) and the monthly volume of covid-related requests in that category during the same time period (darker blue).
In the “Public Safety” category, covid-related requests not only accounted for almost half of the increase in call volume during the early stage of the pandemic but also traced the trend of the changes itself, especially with the peaks in April 2020. COVID-related requests played a larger role in the changes in the “Public Health” category. The panel for “Public Health” category in Figure 5 shows that they explained most of the increase in volume for this category and thus drove its trend. On the other hand, while there are some COVID-related requests in the “Parks & Recreation” category, their volume accounted for a small portion of the monthly increases observed in this category. In addition, the monthly trends of COVID-related requests were misaligned with the monthly trends of changes in the 311 requests volume of this category, suggesting other driving factors at play in this scenario.
DISCUSSION
Relation to existing literature
Compared to existing literature, the share of covid-related requests that we found for Kansas City of 4.3% is similar to the share of covid-specific calls in New York City (4.14%) and the share of pandemic-specific requests in Orange County Florida (5.15%)[20,23]. Like Pamukcu et al., 311 data in Kansas City also showed declines in requests in comparable categories to street conditions and traffic signal conditions[22]. While Pamukcu et al., and our paper both identified pandemic-specific requests via text analysis of the description attribute of the requests, we employed a larger set of keywords with some differences from their framework. We also proceeded to conduct further checks to make sure these keywords were not identifying requests pre-pandemic. However, both sets of results found a significant volume of “Public Safety” calls during the early stage of the pandemic[23]. Different from the existing literature, we extended our analysis to explore the difference between the number of requests made using traditional phone calls vs. web-based services, and how the pandemic affected the tendency in using alternative modes for accessing public services. We found residents relied more on phone and email for covid-related requests compared to non-covid-related requests during the pandemic.
Characterize crisis response
Our results showed that the data from Kansas City 311 system can be used to characterize the impacts of the pandemic on its residents. These patterns and characterization are the first essential step toward using 311 non-emergency service data to make data-driven decisions in terms of resource allocation or identify changes that should be made to the 311 system. Further studies of the 311 systems would be pertinent next steps, including but not limited to system performance through metrics such as response and completion rate, the capacity of the systems by categories and department, and the utilization rate of the systems among its residents. However, the present works lay the grounds for the 311 systems to become the resilient and efficient centralized system to capture and characterize citizens’ crisis response and ultimately provide data-driven timely improvements and reactions during difficult times.
Collect crisis-specific information
Literature on New York City and Orange County, Florida showed that the cities’ proactive adjustments to 311 systems were able to provide valuable new information about the pandemic. These decisions demonstrate the commitment of municipalities to utilizing the system to capture how residents are responding to the ongoing crisis. In particular, New York City’s use of the new “Social Distancing” and “Face Mask Violation” descriptors provides an example of similar changes to existing systems that can offer vital information during times of crisis[22]. Similarly, Orange County’s categorization of different CARES funding programs in their 311 system showed great potential for providing relevant information to the community and the city itself[23].
The methodology proposed in our study of Kansas City 311 data can be applied to 311 data of any city without pandemic-specific descriptors. Hence a framework has been developed to identify pandemic-related requests based on the text description of each request. Note that implementing this framework requires careful data analysis and critical thinking. For instance, in the text mining of Kansas City 311 data, there were cases containing pandemic keywords unrelated to COVID-19 or public health in general. An example is a request under property violations, “Citizen is calling to report 6 feet-tall weeds in the front of this property during the pandemic”. There were requests that did not include COVID-related keywords but were actually related to the pandemic. For example, there were requests that reported a gathering, but they were actually related to the COVID-19 pandemic. This includes “Crowd of people, in violation of mayors’ order. with 15-20 cars and lots of people”.
In the Kansas City 311 system (and possibly other cities’ 311 systems), the existing subcategory “Public Health-Disease Control-All” may be considered as a catch-all category for pandemic-specific requests; However, our research revealed that it is inadequate in encapsulating all COVID-related requests in the system. Only 76.4% of all COVID-related requests were identified through this method. Other significant categories that COVID-related requests fell under are “Public Safety-Police-Other” (4.5%), “Public Health-Food Establishment-Restaurant” (4.4%), “Public Safety-Regulated Industries-Alcohol Business” (3%), “Property Violations” (1.2%), and “Parks & Recreation-Services-Service Issue/Problem” (0.7%). On the other hand, while the “Public Health-Disease Control-All” category started along with the pandemic, there are requests in this category that are not covid-related. For example, requests like “Complainant noticed no soap in the bathroom” or “Smell of odor and staff not wearing gloves while handling food” may not necessarily be related to COVID-19.
While our methods have the abovementioned limitations, our identification and analysis of COVID-related calls revealed new valuable information on how residents of Kansas City were responding to the ongoing crisis. In particular, the biggest concern among COVID-related requests was mask violations, where people fail to wear masks or do not wear masks properly, especially in large gatherings indoors, followed by social distancing. Both tie strongly with mask mandates and social distancing measures to reduce the spread of the COVID-19 pandemic. In addition, citizens were more likely to seek COVID-related non-emergency services through phone and email and less likely to use the web compared to non-COVID-related requests.
There is significant value in collecting crisis-specific information, such as an indicator for pandemic-related calls, in the 311 system to adequately and correctly provide valuable information associated with the ongoing crisis. These adjustments will allow stakeholders to (i) monitor citizens’ crisis-related responses in real time; (ii) provide better support; and (iii) allocate appropriate resources to necessary service areas. While our analysis is specific to Kansas City and its 311 system, there is great potential to generalize this framework to study the non-emergency responses of other 311 systems during a crisis.
CONCLUSION
Our analysis showed that the pandemic led to a considerable decline in the aggregate number of 311 calls in Kansas City. However, the decline was not ubiquitous across different types of service requests where “Public Safety”, “Public Health”, “Trash/Recycling”, “Parks & Recreation”, and “Property/Buildings/Construction” experienced a substantial increase in call volume. We further explored whether these changes were driven by covid-related service requests. Using descriptive text data analysis, we identified 2,379 requests related to the pandemic, accounting for 4.3% of all non-emergency requests in Kansas City between March and August of 2020. More than half of covid-related requests reported mask violations where people fail to wear masks or do not wear masks properly. Compared to non-covid-related requests, citizens were more likely to seek non-emergency services through phone and email and less likely to use the web as means of communication. The COVID-related requests accounted for the majority of changes in “Public Safety” and “Public Health” request volumes as well as the trends in these categories during the early stage of the pandemic.
The present work showed that the data from Kansas City 311 system can be used to characterize the impacts of the pandemic on its residents and provided insights to build a more complete picture of crisis response in the 311 systems across the U.S during the early stage of the pandemic. We utilized the text description of the request to build a framework to identify covid-related requests and conduct further analysis. The designed framework can be utilized and modified to identify pandemic-related non-emergency requests to assist researchers in exploring crisis response patterns in the 311 systems during the pandemic. Hence, local governments can leverage application 311 data to build resilience in the services they provide to their communities.
There are several limitations of the current research. First, as our study relies on 311 data for Kansas City, Missouri, our findings and interpretations are limited to Kansas City. Second, our identification of covid-related requests may have misclassified some cases where requests contained covid-related keywords but were not related to COVID-19, or where requests did not include covid-related keywords but were related to the pandemic. Third, 311 systems are continuously evolving in terms of data collection, request classification, and request tracking, creating challenges for longitudinal studies.
There are many possible extensions from the current work for future research potential, including:
(i) Better data mining and text mining techniques to identify pandemic-related calls and analyze the relationship between different categories to better understand the implications of changes in population behavior more accurately.
(ii) Comparison of different 311 systems given that many municipalities have 311 data publicly available such as New Orleans, Chicago, San Diego, and Houston.
(iii) Design and implement a real-time surveillance system to extract vital information from all 311 systems (or other centralized systems such as 211 systems and 911 systems) during a pandemic.
In summary, the COVID-19 pandemic created a significant, unknown, and unprecedented shock that completely disrupted the lives of citizens and the operation of cities, businesses, and organizations. Given its unexpected nature, 311 systems were not pre-programmed to help jurisdictions respond to the crisis. However, flexibility and resilience that city managers and staff have developed in dealing with natural and man-made disasters provide a framework that can be modified and adopted to improve resilience and response systems. Researchers have coined the term “agile or adoptive governance” to describe the relative ability of various government agencies to respond to the COVID-19 pandemic[26]. As might be expected, the process of adoption was not smooth and left all levels of government and residents struggling to figure out what to do. However, integration of data mining and analytics as presented in this study can be used to develop early warning systems for the emergence of new and unexpected disruptors. This will enable managers and 311 system operators to modify data collection and classification systems to better track how such shocks are playing out, thus providing a basis for developing proactive responses rather than being forced to be reactive. Such integration can help develop more resilient systems that support municipalities and efforts to serve their communities.
DECLARATIONS
Authors’ contribution
Conceptualization, data, methodology, software, writing - original draft & review: Tran T
Conceptualization, research design, data, supervision, review: Bani-Yaghoub M
Conceptualization, literature: DeLisle J
Availability of data and materials
To ensure reproducibility, the data and code used in this study have been made publicly available in our Git repository. Researchers interested in replicating or building upon our study can access the data and code from this repository.
Financial Support and sponsorship
None.
Conflicts of interest
All authors declared that there are no conflicts of interest.
Ethical approval and consent to participate
Not applicable.
Consent for publication
Not applicable.
Copyright
© The Author(s) 2023.
REFERENCES
1. Merrill D. A very popular teenager. Urgent Commun 2012;30:16-9. Available from: https://urgentcomm.com/2012/06/01/a-very-popular-teenager-with-related-video/ [Last accessed on 23 March 2023]
3. Estevez E, Janowski T. Electronic governance for sustainable development - conceptual framework and state of research. Gov Inf Q 2013;30:S94-109.
4. Ojo A, Janowski T, Estevez E. Whole-of-government approach to information technology strategy management: building a sustainable collaborative technology environment in government. Inf Polity 2011;16:243-60.
5. Chen T, Guo W, Gao X, Liang Z. AI-based self-service technology in public service delivery: user experience and influencing factors. Gov Inf Q 2021;38:101520.
6. Dawson K. Your newest competitor local government. Call Center Mag 2005;18:6.
7. Grabner Jr B. Emergency alerts. Am City County 2008;123:24. Available from: https://www.americancityandcounty.com/2008/12/01/government-technology-emergency-alerts/ [Last accessed on 23 March 2023]
8. Dombrowski C. One call away. Am City County 2005;120:46-51.
9. Bailor C. Striking back with 311. CRM Mag 2006;10:11. Available from: https://www.destinationcrm.com/Articles/CRM-Insights/Insight/Striking-Back-with-311-43222.aspx [Last accessed on 23 March 2023]
10. World Health Organization Coronavirus Disease 2019 (COVID-19) Situation Report - 92. Available from: https://www.who.int/docs/default-source/coronaviruse/situation-reports/20200421-sitrep-92-covid-19.pdf?sfvrsn=38e6b06d_6%20 [Last accessed on 20 Mar 2023].
11. Notice on the Continuation of the National Emergency Concerning the Coronavirus Disease 2019 (Covid-19) Pandemic. Available from: https://www.whitehouse.gov/briefing-room/presidential-actions/2022/02/18/notice-on-the-continuation-of-the-national-emergency-concerning-the-coronavirus-disease-2019-covid-19-pandemic-2/ [Last accessed on 20 Mar 2023].
12. Timing of state and territorial COVID-19 stay-at-home orders and changes in population movement - United States. Available from: https://www.cdc.gov/mmwr/volumes/69/wr/mm6935a2.htm#:~:text=Stay%2Dat%2Dhome%20orders%20are,population%20movement%20in%20most%20counties [Last accessed on 20 Mar 2023].
14. Moosavi J, Fathollahi-Fard AM, Dulebenets MA. Supply chain disruption during the COVID-19 pandemic: Recognizing potential disruption management strategies. Int J Disaster Risk Reduct 2022;75:102983.
15. Swanson D, Santamaria L. Pandemic supply chain research: a structured literature review and bibliometric network analysis. Logistics 2021;5:7.
16. Pujawan IN, Bah AU. Supply chains under COVID-19 disruptions: literature review and research agenda. Supply Chain Forum 2022;23:81-95.
17. Siegrist M, Luchsinger L, Bearth A. The impact of trust and risk perception on the acceptance of measures to reduce COVID-19 cases. Risk Anal 2021;41:787-800.
18. Yuan J, Zou H, Xie K, Dulebenets MA. An assessment of social distancing obedience behavior during the COVID-19 post-epidemic period in china: a cross-sectional survey. Sustainability 2021;13:8091.
19. Khorram-Manesh A, Dulebenets MA, Goniewicz K. Implementing public health strategies-the need for educational initiatives: a systematic review. Int J Environ Res Public Health 2021;18:5888.
20. Lieberman-Cribbin W, Alpert N, Gonzalez A, Schwartz RM, Taioli E. Three months of informational trends in COVID-19 across New York City. J Public Health 2020;42:448-50.
21. Eugene A, Alpert N, Lieberman-Cribbin W, Taioli E. Trends in COVID-19 school related inquiries using 311 New York city open data. J Community Health 2021;46:1177-82.
22. Pamukcu D, Christopher Z. Characterizing 311 System reactions to a global health emergency. In Proceedings of the 54th Hawaii International Conference on System Sciences. 2021.
23. Pamukcu D, Christopher WZ, Ge Y. Analysis of orange county 311 system service requests during the COVID-19 pandemic. In Proceedings of the 18th International Conference on Information Systems for Crisis Response and Management. 2021. Available from: http://idl.iscram.org/files/duygupamukcu/2021/2326_DuyguPamukcu_etal2021.pdf [Last accessed on 23 March 2023].
24. Yildirim Y, Arefi M. Noise complaints during a pandemic: a longitudinal analysis. Noise Mapping 2021;8:108-15.
25. Chetty R, John NF, Nathaniel H, Michael S. The economic impacts of COVID-19: evidence from a new public database built using private sector data. USA: National Bureau of Economic Research; 2020.
Cite This Article
Export citation file: BibTeX | RIS
OAE Style
Tran T, Bani-Yaghoub M, DeLisle JR. Non-emergency responses in the 311 system during the early stage of the COVID-19 pandemic: a case study of Kansas city. Dis Prev Res 2023;2:3. http://dx.doi.org/10.20517/dpr.2022.08
AMA Style
Tran T, Bani-Yaghoub M, DeLisle JR. Non-emergency responses in the 311 system during the early stage of the COVID-19 pandemic: a case study of Kansas city. Disaster Prevention and Resilience. 2023; 2(1): 3. http://dx.doi.org/10.20517/dpr.2022.08
Chicago/Turabian Style
Tran, Thao, Majid Bani-Yaghoub, James R. DeLisle. 2023. "Non-emergency responses in the 311 system during the early stage of the COVID-19 pandemic: a case study of Kansas city" Disaster Prevention and Resilience. 2, no.1: 3. http://dx.doi.org/10.20517/dpr.2022.08
ACS Style
Tran, T.; Bani-Yaghoub M.; DeLisle JR. Non-emergency responses in the 311 system during the early stage of the COVID-19 pandemic: a case study of Kansas city. Dis. Prev. Res. 2023, 2, 3. http://dx.doi.org/10.20517/dpr.2022.08
About This Article
Special Issue
Copyright

Data & Comments
Data
0

 Cite This Article 16 clicks

 Like This Article 27
likes
Like This Article 27
likes


Comments
Comments must be written in English. Spam, offensive content, impersonation, and private information will not be permitted. If any comment is reported and identified as inappropriate content by OAE staff, the comment will be removed without notice. If you have any queries or need any help, please contact us at support@oaepublish.com.