
Wind risk assessment of urban street trees based on wind-induced fragility


Abstract
The failure of urban street trees caused by strong winds and has several adverse effects on urban functions and public safety. This study developed a wind fragility model based on the mechanical analysis of urban street trees. The uncertainty of the important parameters involved in this model was quantified for species of interest. Specifically, the vine copula function was used to estimate the joint probability distribution of the geometric parameters. Furthermore, the tree fragility curves were obtained and then validated by the historical measured date. The proposed model may help in effectively identifying high-risk streets and regions.
Keywords
INTRODUCTION
The breakage and falling of street trees caused by extreme winds may lead to direct economic losses and indirect impacts, such as the failure of structures, lifeline facilities, and traffic systems, which severely threaten the lives and properties of residents.
Existing studies on wind damage to trees can be roughly categorized into mechanistic and statistical approaches. The statistical approach directly estimates the probability of damage and the factors influencing tree failures from historical data using various regression and statistical techniques[1,2]. However, because the date used for statistical analysis is typically locally specific, it has not been confirmed whether the developed statistical model can be generalized[3,4]. Moreover, statistical models face difficulties in elucidating the actual mechanism of wind effects on trees.
In contrast, the mechanistic approach is predominant in studies on wind-induced tree failure. As early as 1881, Greenhill investigated the stability of trees using a bottom-fixed tapered rod[5]. Subsequently, researches on the mechanistic tree model developed toward two directions. One direction tends to develop increasingly more refined and sophisticated tree models[6,7]. The finite element model considering precise tree geometry and wind-tree interaction is particularly popular[8-14]. The other direction is more practical and application-oriented. It tends to use models with relatively simple geometry, and focuses on the specification and quantification of the key model parameters. Specifically, HWIND[15], GALES[16], and FOREOLE[17] are the most widely investigated models. The three above-mentioned modeling approaches simplify the tree as a tapered rod and adopt quasi-static analysis[18]. The widely acknowledged Hazus model for multi-hazard loss estimation[19] involves a module for tree blowdown, whereby an individual tree is modeled as a single-degree-of-freedom (SDOF) oscillator. However, the accuracy of this model is still unsatisfactory.
To evaluate the wind risk, most mechanistic models, such as HWIND, GALES, and FOREOLE, resort to calculating the critical wind speed (CWS) required to cause the damage to an "average tree"[18,20]. In contrast, the Hazus tree blowdown model estimates tree damage using the fragility curve, that is, by calculating the conditional failure probability corresponding to different wind speeds. Owing to the inherent randomness of tree morphology, the environment, and tree failure occurrence, this study adopted the fragility scheme for risk assessment.
However, almost all the above-mentioned studies have focused either on forest trees or simply on individual trees. Despite the severe and potentially catastrophic impact of urban tree failure[21,22], and the significant differences between the wind environment and tree features of urban areas and forests[23], few studies have established quantitative wind risk assessment models for urban trees[24]. Studies focusing on trees in urban areas have practical significance, while the computational efficiency of the single-tree model is important for facilitating subsequent city-scale analysis.
This study developed a wind risk assessment model for trees in urban streets. To predict wind-induced failure, a mechanistic model based on the HWIND and GALES models is proposed. Further, focusing on the quantification of the involved uncertainties, the probability distributions of significant parameters were investigated in detail. Specifically, the joint probability distributions of the geometric parameters were estimated using the vine copula function, based on the data from an urban tree database. Finally, the tree fragility curves were obtained and validated.
MECHANISTIC WIND DAMAGE TREE MODEL
A mechanistic tree model for the deterministic analysis of a single tree subjected to wind loading is proposed. The proposed model combines the HWIND and GALES models, and involves the simplification of trees into a cantilever corresponding to the trunk, as shown in Figure 1. The cantilever beam is separated into several elements. Each element is considered as a cylinder, and the wind load is considered to be uniformly distributed on each element. Subsequently, the internal force and stress of each node can be calculated and the tree damage can be assessed.
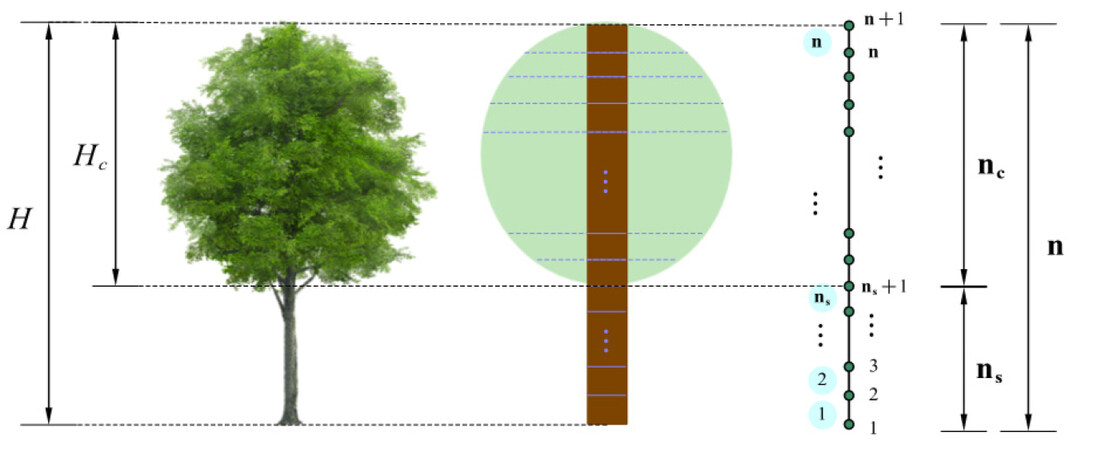
Figure 1. Diagram of tree model. H: tree height; Hc: crown height; n: number of elements; nc: number of elements in crown area; ns: number of elements in stem area.
Parameters of tree model
The basic parameters required to determine the proposed structural model are geometric and material parameters.
The three most fundamental geometric parameters of trees are the diameter at breast height (DBH), crown diameter (Dc), and crown height (Hc). All of them can be considered as random variables depending on the tree height and will be discussed in later sections.
Except for the three fundamental parameters, the taper equation of the trunk is essential for determining the element diameters. The proposed model adopts the widely used Max and Burkhart equation, which is expressed as follows[25]:

where dz denotes the stem diameter at height z; b1, b2, b3, and b4 are the shape parameters; a1 is the relative height of the first knot, that is, the point of transition between a paraboloid and a cone in the upper part of the stem; a2 is the relative height of the second point of transition between a neiloid and a paraboloid in the lower part; I1 = 1 if z/H < a1, otherwise I1 = 0; I1 = 1 if z/H < a2, otherwise I2 = 0.
The crown shape is an important geometric factor for tree modeling because it directly affects the estimated wind loads on trees. The following relationship is used to fit the crown profile[26]:

where dci denotes the crown diameter of the i-th element from the bottom of the crown; nc is the number of elements in the crown area; t is the shape parameter. According to the US urban tree database[27], most conifers have a paraboloid crown, that is, they are widest at the bottom third of the crown. Herein, the shape parameter for conifers was considered as 1.4[26], which satisfies the shape of a paraboloid. The dominant crown shape of broadleaf trees is ellipsoid; therefore, the shape parameter was considered to be equal to 2.
The material parameters include the stem density ρs, crown-to-stem weight ratio rcs, and modulus of rupture σr. Species-varying random variables are considered. The values and distributions of these parameters are discussed below.
Loads on trees
The self-weight of trees is calculated using elements. For elements in the crown area, the weight of the element is the combination of the stem and crown weight. The weight of the stem can be determined from the stem density ρs and stem diameter at the height of each element. The weight of the crown can be calculated from the crown-to-stem weight ratio rcs. Then, the crown weight is assigned to each crown-area element according to the crown diameter Dci of that element.
The mean wind speed at the top of the tree  can be obtained from the power law[28] as follows:

where U10 is the 10-min mean wind speed at the height of 10 m, and a is the ground roughness coefficient. Hereafter, unless otherwise specified, all mean wind speeds are averaged over a 10-min period. Within the tree height, the mean wind speed can be calculated as follows[10]:

Because quasi-static analysis is adopted for the proposed tree model, the effect of the fluctuating wind is considered by introducing a gust factor, as follows:

where Up is the peak wind speed, and  denotes the mean wind speed. The gust factor is considered as a random parameter and will be discussed in a later section.
The wind load on each element is represented by a point load concentrated at the center of the element, as follows:

where CD is the drag coefficient (for elements in the crown area, CD is taken as 0.25 for broadleaf species, and 0.3 for conifers[16,29]; otherwise, CD is taken as 1[29]); ρa denotes the air density and takes the value of

where (z) is the mean wind speed at height z; Ai is the area against the wind of the element; UP(zi) = Gf denotes the peak wind speed at height zi, and zi is the height of the center of the element.
Failure determination
The overall and local failure of trees are considered. The overall failure includes the stem breakage mode and uprooting (or overturning) mode, while local failure refers to the branch breakage mode, which is typically more likely to occur compared with overall failure, but has a negative impact on the urban road environment as well.
Table 1 summarizes the specific failure criterion of each failure mode employed in this model. Notably, owing to the taper equation adopted herein, the element diameters shrink rapidly when approaching the canopy, as shown in Figure 2A. Consequently, for broadleaf species, the section stress along the tree height always exhibits a double-peak mode, as shown in Figure 2B, and the largest peak typically occurs at the second node from the top. It is clear that the overall breakage of the stem cannot be determined by this peak at the top area. Therefore, the model is divided into two parts: one corresponding to the trunk and the other corresponding to the branches. The midline of the crown is considered as the approximate boundary of these two regions.
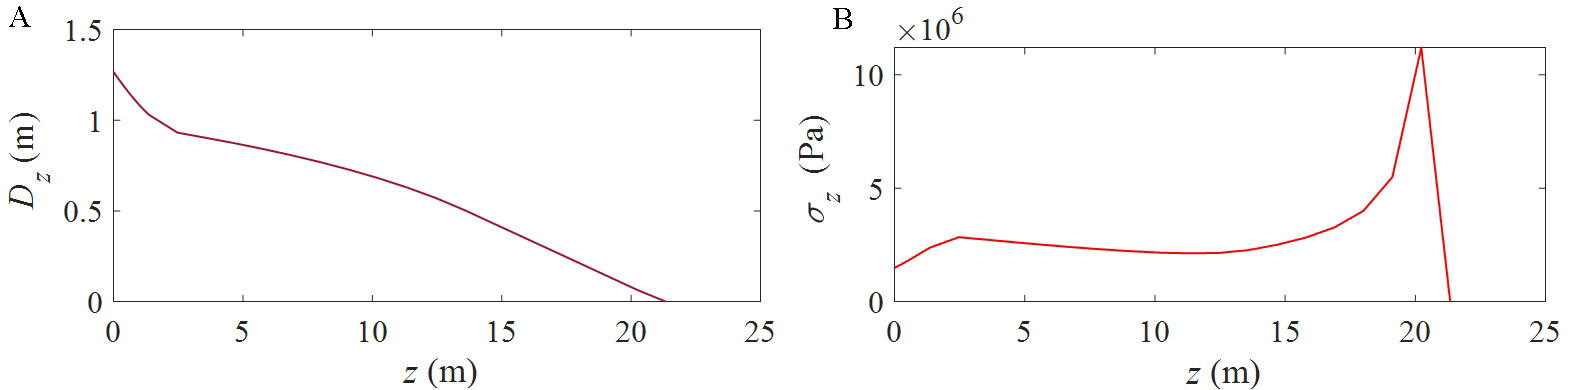
Figure 2. Typical section diameter and stress of broadleaf species. (A) Section diameter; (B) Section stress.
Description of failure modes
| Failure category | Failure mode | Failure criterion |
| Overall Failure | Uprooting | Base bending moment (Mb) exceeds the critical uprooting moment (Mb, crit) |
| Stem breakage | Maximum section stress in the trunk region (σmax, s) exceeds the modulus of rupture (σr) | |
| Local Failure | Branch breakage | Maximum section stress in the branch region (σmax, b) exceeds the modulus of rupture (σr) |
The failure criterion for uprooting is expressed as follows:

In this equation, the critical base moment Mb, crit against uprooting can be determined as follows[16]:

where Ws(kg) denotes the stem weight, and Creg (Nm·kg-1) is a regression constant that comprehensively reflects the root and soil characteristics. In the proposed model, Creg is considered as a random variable, and its value and distribution are discussed later.
The bending moment of each node is obtained as follows:

where Fj denotes the wind load given by Equation (6); n is the total number of elements, and the nodes are counted from the base to the top. Further, the base bending moment, which is also the maximum moment, is obtained as follows:

Notably, the additional moment in the HWIND model, which accounts for the p-delta effect caused by the self-weight and wind-induced horizontal displacement, is not considered herein because the proposed model only considers the linear-elastic response of trees. Consequently, the additional moment is relatively small compared with the moment generated directly by the wind loads. Figure 3 shows the comparison between the additional moment and the direct moment from wind for U10 = 40 m/s. Note that, the additional moment increases with the wind speed. However, as can be seen, the additional moment is still negligible even for U10 up to 40 m/s. The simplification of neglecting the additional moment in the proposed model greatly reduces the computational costs. It is because it eliminates the calculation of structural displacement for the determination of the additional moment.
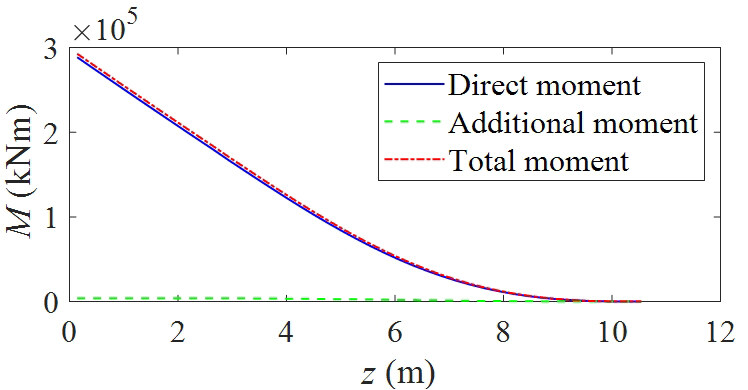
Figure 3. Comparison of additional moment and direct moment.
The failure criterion for stem breakage is expressed as follows:

where σmax, s is the maximum stress in the stem region, and is expressed as follows:

where  means rounding off to the nearest whole number; nc is the number of elements in the crown region; σi denotes the stress at node i, and is expressed as follows[29]:

where di, Ai, and Ii denote the diameter, area, and moment of inertia of the stem cross section at node i, respectively; Mi can be calculated using Equation (10); Ni is the axial force caused by the self-weight.
The failure criterion for branch fracture is expressed as follows:

where σmax, b denotes the maximum stress in the stem region and is expressed as follows:

QUANTIFICATION OF STOCHASTIC PARAMETERS
In this section, the stochastic parameters involved in the proposed mechanistic model are quantified. Specifically, the joint distributions of the geometric parameters are fitted using data from the USDA urban tree database[27] via copula functions. However, owing to the lack of data, the probability distributions of material parameters are given empirically with mean values obtained from the literature. The distribution of the wind gust factor is identified from the time histories of the fluctuating winds generated using the Davenport spectrum[30].
Because the geometric and material parameters of trees are species-dependent, to facilitate the model validation discussed in the next section, typical broadleaf trees and conifers were considered as the target species in this study. Notably, the same methodology can be applied to the analysis of other specific species when the corresponding information is provided.
Geometric parameters
The basic geometric parameters, that is, the diameters at breast height (DBH), crown diameter (Dc), and crown height (Hc) are estimated by the polynomial functions of the tree height (H).
The data used for regression were obtained from the USDA urban tree database[26]. For each species, the regression parameters and the distribution of random variables were fitted. The model employed to fit the data points is expressed as follows:

where yi is the i-th sample value of the parameter, and may refer to DBH, Dc, or Hc; xi is the tree height (H) of the i-th sample; f (x) denotes the regression polynomial function; θi is the i-th sample value of the random variable corresponding to the considered parameter.
The distributions of random variables θDBH, θDc, and θHc are considered to be independent of the tree height H. Figure 4 shows the samples of θDBH, θDc, and θHc against H for various typical cases. For varying values of H, all three random variables are approximately homoscedastic.

Figure 4. Part of data of geometric random variables θDBH, θDc, and θHc. DBH: diameter at breast height; Dc: crown diameter; Hc: crown height; θi: random variable corresponding to considered parameter. (A) θDBH of broadleaf species; (B) θDc of broadleaf species; (C) θHc of conifers.
The linear polynomial function is employed for the regression of diameter at breast height (DBH) and crown height (Hc); the quadratic regression function is used for the crown diameter (Dc). The comparisons of the regression functions are presented in Figure 5, and the parameters obtained by the least squares algorithm are presented in Table 2. As shown in Figure 5, compared with the other two geometric random variables, the differences among the crown height (Hc) regression results for different species are relatively small, and the corresponding variance in the samples is the smallest.
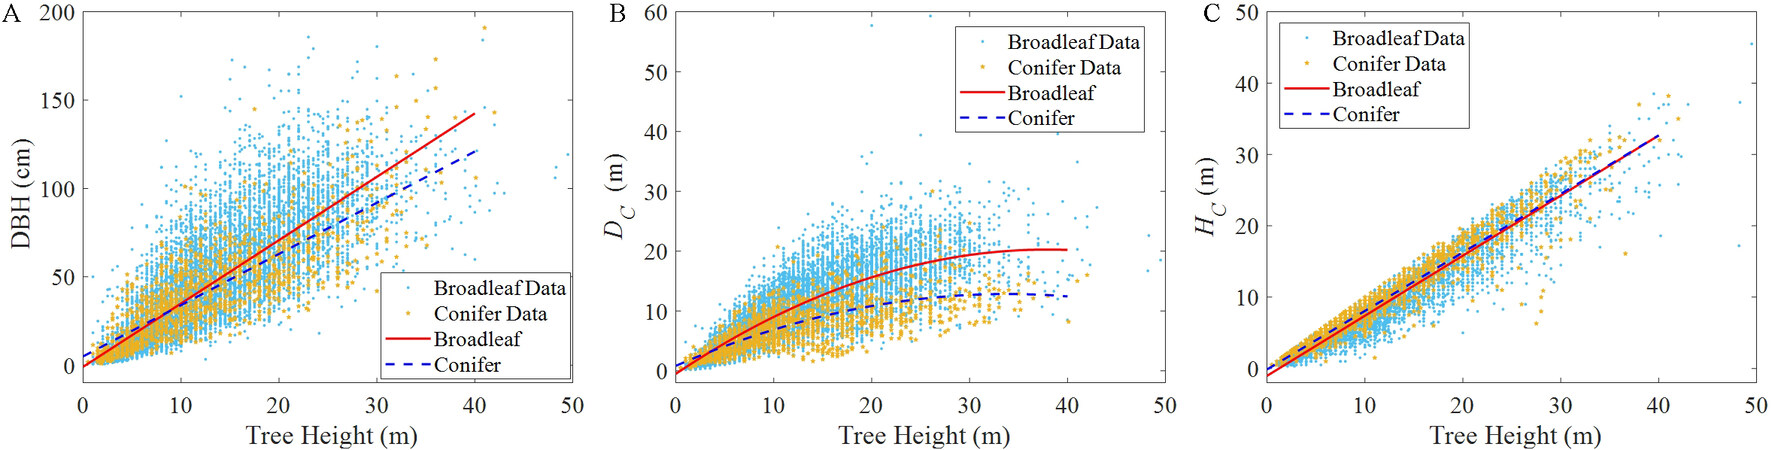
Figure 5. Regression results for DBH, Dc, and Hc of different species. DBH: diameter at breast height; Dc: crown diameter; Hc: crown height. (A) diameter at breast height DBH; (B) crown diameter Dc; (C) crown height Hc.
Regression parameters for different species and geometric parameters (for linear function, f (x) = ax + b; for quadratic function, f (x) = ax2+ bx +c)
| Species | DBH (cm) | Dc (m) | Hc (m) |
| Broadleaf | a = 3.5857 b = -0.9613 | a = -0.0144 b = 1.0950 c = -0.5046 | a = 0.8424 b = -1.0316 |
| Conifer | a = 2.8993 b = 4.9477 | a = -0.0105 b = 0.7091 c = 0.8331 | a = 0.8203 b = -0.1333 |
Before constructing the joint distribution of the random variable using copula theory, the marginal distributions of the variables were determined. In this study, five distribution types, namely, the normal distribution, lognormal distribution, Gamma distribution, Weibull distribution, and Burr type XII distribution, were considered and fitted by the maximum likelihood estimation.
Figure 6 shows the fitting results for the distributions of typical broadleaf trees.
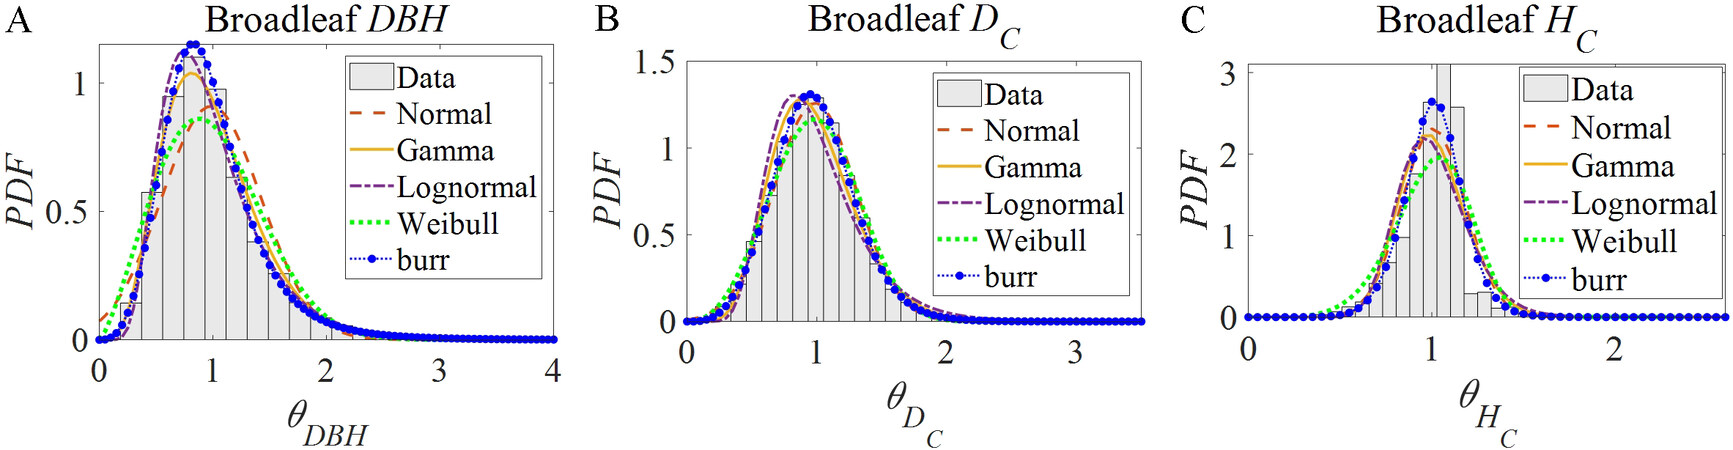
Figure 6. Fitting results for assumed marginal distributions of geometric random variables of broadleaf trees. DBH: diameter at breast height; Dc: crown diameter; Hc: crown height; θi: random variable corresponding to considered parameter. (A) diameter at breast height θDBH; (B) crown diameter θDc; (C) crown height θHc.
The D value in the Kolmogorov-Smirnov (K-S) test was used to determine the best-fitted distribution, as follows[31]:

where F (x) denotes the assumed cumulative density function (CDF) of random variable X, and Sn (x) is the stepwise cumulative frequency function of the sample data. Table 3 gives the best-fitted distribution of each species and geometric random variable, and the corresponding parameters.
Best-fitted distribution and parameters of geometric random variables
| Species | θDBH | θDc | θHc | |||
| Distribution | Parameters | Distribution | Parameters | Distribution | Parameters | |
| Broadleaf | Burr | α = 1.0269 c = 3.7257 k = 1.3808 | Burr | α = 1.3840 c = 4.0562 k = 3.2724 | Burr | α = 1.1243 c = 9.0512 k = 2.1530 |
| Conifer | Burr | α = 1.3891 c = 3.1537 k = 2.7291 | Gamma | a = 6.4717 b = 0.1527 | Weibull | a = 1.0626 b = 7.9837 |
The joint distributions of the geometric random variables (θDBH, θDc, and θHc) for each species are estimated by copula theory. To determine the dominating variable for constructing the vine copula structure, the Pearson, Spearman, and Kendall correlation coefficients for each random variable pair of all considered species were calculated as presented in Table 4. As can be seen, the correlation between
Correlation coefficients for each random variable pair
| Type of corr. coeff. | Random variable pairs | Broad-leaf | Conifer |
| Pearson | [θDBH, θDc] | 0.659 | 0.705 |
| [θDBH, θHc] | -0.173 | -0.088 | |
| [θDc, θHc] | -0.144 | -0.100 | |
| Spearman | [θDBH, θDc] | 0.711 | 0.729 |
| [θDBH, θHc] | -0.182 | -0.087 | |
| [θDc, θHc] | -0.135 | -0.152 | |
| Kendall | [θDBH, θDc] | 0.525 | 0.545 |
| [θDBH, θHc] | -0.124 | -0.060 | |
| [θDc, θHc] | -0.091 | -0.103 |
Herein, five copula function types were considered: the Ali-Mikhail-Haq (AMH) copula, Frank copula, Clayton copula, Gaussian copula, and t copula. According to the Akaike information criterion (AIC), the best-fitted copula has the minimum AIC value[33]. For each random variable pair, the best-fitted copula functions and their parameters are presented in Table 5. Figure 7 shows the comparison between the original 11,567 data points and the 1000 samples generated by the estimated vine copula function and marginal distributions for broadleaf trees. As can be seen, the results are in good agreement.
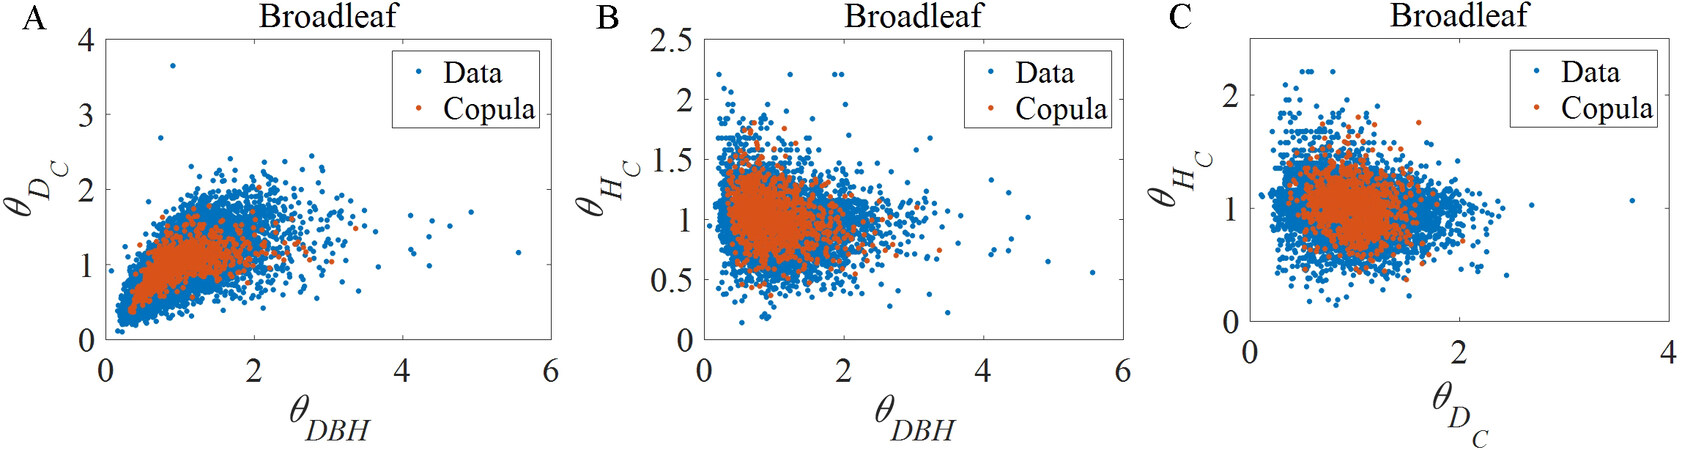
Figure 7. Comparison of samples generated by copula function and original data. DBH: diameter at breast height; Dc: crown diameter; Hc: crown height; θi: random variable corresponding to considered parameter. (A) [θDBH, θDc]; (B) [θDBH, θHc]; (C) [θDc, θHc].
Best fitted copula function and their parameters
| Species | (uDBH, uDc) | (uDBH, uHc) | (wDc|DBH, wHc|DBH) | |||
| Copula | Parameters | Copula | Parameters | Copula | Parameters | |
| Broadleaf | t | ρ = 0.7256 ν = 8.7194 | t | ρ = -0.1937 v = 7.8419 | t | ρ = -0.6687 ν = 31.3205 |
| Conifer | Frank | θ = 6.6617 | t | ρ = -0.0962 ν = 7.2625 | Frank | θ = -0.0624 |
Material Parameters and critical bending moment
In the proposed model, the random material and strength parameters of trees include the stem density ρs, modulus of rupture σr, crown-to-stem weight ratio rcs, and regression coefficient of critical bending moment Creg. Similar to the geometric parameters, these parameters are expressed as follows:

where X is a random material parameter and may refer to ρs, σr or rcs;  denotes the mean value of the random parameter; θ is a random variable with a mean equal to 1, and the standard deviation is equal to the coefficient of variation of X.
The construction of accurate probabilistic distributions of the model parameters is always desirable. However, because a large data set of material parameters is not yet available, their distributions must be assumed based on experience. In the proposed model, the lognormal distribution is adopted for all random material and strength variables. The distribution parameters are determined by moment estimation; therefore, the mean value and the coefficient of variation of the parameters still need to be determined.
The USDA Wood Handbook[34] provides the specific gravity (Sg) and modulus of rupture (σr) of various species. Notably, all material parameters in this model should take the value of green trees instead of overdried wood. With Sg of green trees, the stem density (ρs) can be obtained as follows:

where MC denotes the moisture content of the green trees of the specific species considered, and
The mean values of MC, Sg, ρs, and σr are listed in Table 6. Herein, the mean and coefficients of variation for the above-mentioned material parameters of typical broadleaf trees (or conifers) are estimated by the data of all available hardwood (or softwood) species in the USDA Wood Handbook, and each species has the same weight in the computation.
Mean values of MC, Sg, ρs, and σr of different species
| Species | MC (%) | Sg | ρs (kg/m3) | σr (107 Pa) |
| Broadleaf | 86 | 0.517 | 923.9 | 5.57 |
| Conifer | 105 | 0.401 | 802.2 | 4.34 |
Owing to the lack of supporting materials, the crown-to-stem weight ratio rcs is not considered as species-dependent. The crown weight is approximately 28.0% ± 3.3% of the fresh weight of an entire tree[35]; therefore, rcs is approximately39% ± 6.5%. Consequently, in this study, the mean rcs value was considered as 0.39, and the coefficient of variation was considered as 0.167.
The regression coefficient Creg of the critical base moment for uprooting failure is also species-dependent. Many experimental studies have been conducted to measure the value of Creg for different species and various root and soil conditions[16,20,29,36-38]. In previous studies, the value of Creg varied from 67 to more than 200. However, owing to the enormous experimental cost of measuring Creg, the data of Creg are still limited to an extent that makes it rather difficult to obtain a reasonable distribution of Creg for different species and the root and soil properties. Therefore, in this study, Creg was only considered as species-dependent. The mean values of Creg for general broadleaf species and conifers are identified in the following model validation procedure, respectively, and the standard deviation of θCreg was set to 0.2.
The conclusions regarding the random variables for the stem density, modulus of rupture, crown-to-stem weight ratio, and regression coefficient of the critical base moment, that is, θρs, θσr, θrcs and θCreg, respectively, are presented in Table 7.
Random variables of material and strength properties
| Random variable | Distribution | Mean/Standard deviation |
| θρs | Lognormal | μ = 1, σ = 0.1403 (Broadleaf) |
| μ = 1, σ = 0.1403 (Conifer) | ||
| θσr | Lognormal | μ = 1, σ = 0.2499 (Broadleaf) |
| μ = 1, σ = 0.2499 (Conifer) | ||
| θrcs | Lognormal | μ = 1, σ = 0.167 |
| θCreg | Lognormal | μ = 1, σ = 0.2 |
Gust factor
In this study, the gust factor was calculated by the ratio of the 1-second gust to the 10-min mean wind speed. The fluctuating wind speed can be considered as a Gaussian stationary process. For an initial variate satisfying the Gaussian distribution N (μ, σ), the maximum value obtained for samples with size n satisfies the Gumbel distribution for large n[31]. For the gust factor Gf in Equation (5), its corresponding initial variate satisfies N (1, I10), where I10 denotes the coefficient of variation of the wind speed at the height of 10 m. Therefore, the distribution of Gf can be obtained as follows:

where FGf (y) denotes the CDF of Gf, and the following relationships hold:
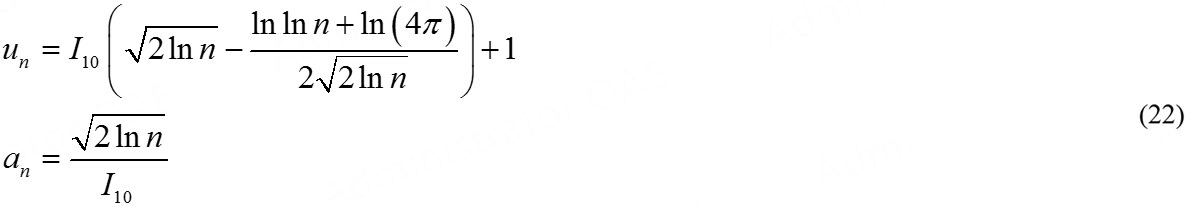
As can be seen, if I10 is known, the distribution of Gf can be fully determined with sample size n. According to China’s specification for the design load of buildings (GB 50009-2012), for urban areas with dense building clusters, I10 can be taken as 0.23[39]. Then, the following empirical value of n is used in this model:

For each  , Eq. (23) is approximated from 10,000 time series with a 10-min period and the sampling frequency of 1 Hz, as determined by the corresponding Davenport Spectrum[30]. Notably, there are other distributions of instantaneous maximum wind speed that similarly have a double exponential form. These distributions also require the estimation of certain parameters when applied to the quasi-static analysis[40]. All of these distributions are reasonable approximations when the sample size n is large. Therefore, this study adopted the widely used Gumbel distribution.
WIND FRAGILITY AND MODEL VALIDATION
The probabilistic mechanical model was validated in the same manner using the same survey data as the Hazus model.
In the technical manual of Hazus-MH 2.1, the blowdown results for 1158 trees (628 conifer and 530 deciduous trees) in eight residential subdivisions in eastern North Carolina caused by Hurricane Isabel in 2003, and the estimated peak gust wind speed of each subdivision, are provided[19]. Trees are divided into conifers and deciduous trees by species, and into four classes by height, amounting to a total of eight classes. Because the sample size at each surveyed site is not sufficient to allow a reasonable estimation of the failure property if considered separately, the Hazus manual proposes a weighted average scheme to make use of these measured data[19]. For each tree class at all surveyed sites, the weighted average blowdown probability for trees, and the corresponding weighted wind speed, were calculated as indicated by the star symbol in Figure 8. The model will be validated if, for all tree classes, the estimated fragility curve passes through the corresponding weighted average point. Notably, only the estimated peak gust wind speed of each site is provided, while the proposed model is based on the mean wind speed. Therefore, the mean wind speed of each site can be further estimated using the following expression:

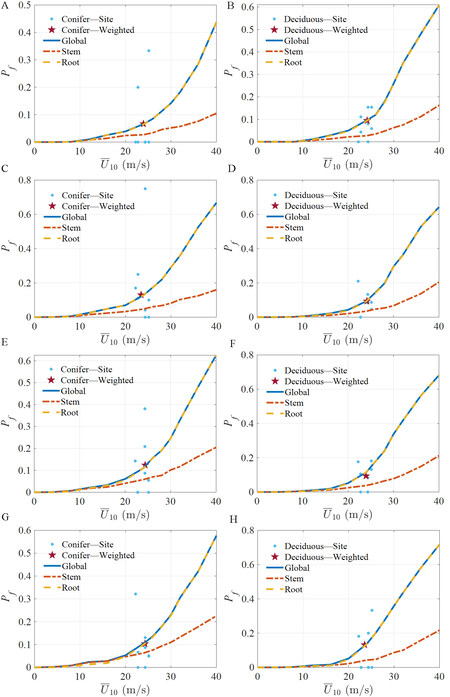
Figure 8. Model validation results. H: tree height; Creg: regression coefficient; Pf: failure probability; U10: mean wind speed in 10 min at height of 10 m. (A) Coniferous tree, H = 20 feet (6.1 m),  = 130; (B) Deciduous tree, H = 20 feet (6.1 m), = 160; (C) Coniferous tree, H = 35 feet (10.7 m), = 120; (D) Deciduous tree, H = 35 feet (10.7 m), = 180; (E) Coniferous tree, H = 50 feet (15.2 m), = 145; (F) Deciduous tree, H = 50 feet (15.2 m), = 180; (G) Coniferous tree, H = 70 feet (21.3 m), = 165; (H) Deciduous tree , H = 70 feet (21.3 m), = 180.
where Up denotes the provided peak wind speed; g denotes the peak factor, and is considered as 3.0 in accordance with the Hazus manual[19]; Iu denotes the turbulence intensity and was considered to be the same as I10 for an urban area, that is, equal to 0.23.
By employing the proposed model, the failure probability Pf at each was calculated by Monte Carlo simulation with 10,000 samples. The proposed mechanistic model has fairly high efficiency, and the computation of one fragility curve takes no more than one second. Therefore, the proposed model can be easily extended to city-scale when various tree species, tree heights, and other dominant tree properties must be considered separately.
The survey data and estimation results for eight tree classes are shown in Figure 8 Because only the height ranges of four tree height classes are available, and there is no information on the specific height of each sample tree, a representative height was selected for each height class. The tree height information of the validation data is initially given in feet. In Figure 8, the representative heights measured in feet and meters are given simultaneously. Because the survey did not provide data for the local damage of trees, this failure mode was not considered in the model validation. Recall that the mean values of Creg (denoted by ) still need to be determined. The value used in the estimation of each tree class is noted in the corresponding subplot in Figure 8 All estimated values lie within a reasonable range, which indicates the rationality of the proposed model.
Another phenomenon observed in the estimation is that the dominant failure mode is uprooting at the weighted wind speed. Actually, there is certain regularity between the dominant failure mode estimated by the proposed model and the wind speed. When the wind speed is low, the dominant failure mode is stem fracture, while the failure probability in this stage is typically too low to be heeded. When the wind speed increases, the trees are more likely to fail at the root.
As a further exploration, the significance of the correlation of random model parameters, that is, the necessity of applying the vine copula functions, was investigated. As shown in Figure 9, there is a significant difference between the fragility curves obtained by the proposed vine copula function and those obtained from independent geometric parameters with the same marginal distributions. Undoubtedly, this demonstrates the necessity of considering the correlation of random parameters and the advantage of applying the vine copula function in the proposed model. Moreover, it shows that the probability distributions of model parameters are very important to fragility analysis; therefore, future studies should pay more attention to this issue.
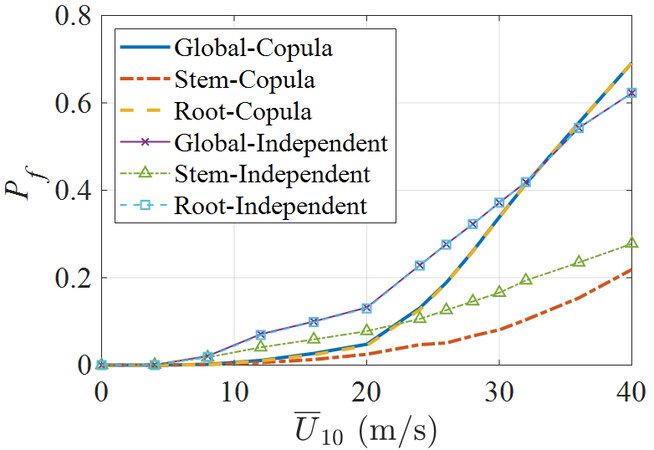
Figure 9. Comparison of fragility curves of typical deciduous tree. Pf: failure probability; U10: mean wind speed in 10 min at height of
CONCLUDING REMARKS
This paper proposes a wind risk assessment model for trees in urban streets. Specifically, based on a mechanistic tree model with elaborated considerations of the model parameter uncertainties, a probabilistic model for calculating the fragility of urban street trees was established. By using a sufficient amount of available data, the joint probability distributions of the fundamental geometric parameters of trees were obtained based on the vine copula theory. Moreover, the wind fragility curves of typical broadleaf trees and conifers were obtained. The comparison of the results obtained by the proposed model to survey data confirmed the validity of the proposed model.
The significance of accurate probability modeling in risk assessment was emphasized. In addition to the marginal probability distribution of each parameter, the correlation and dependence of parameters are also important. Copula functions provide a feasible approach toward accurately constructing the joint distributions of random parameters using parametric and explicit expressions.
The proposed mechanistic model is fairly efficient and is expected to be applied to wind risk assessment at the city scale. However, owing to the lack of data, there are still many deficiencies in the parameter quantification and model validation of the current model. Issues to be further improved include the following: (1) accurate modeling of the distribution of material and strength parameters with the support of more experimental data; (2) considering the influence of root characteristics and root-soil interaction; and (3) comprehensive validation of proposed model with the support of additional survey data and refined numerical analysis.
DECLARATIONS
Authors’ contributionsPerformed data gathering and analysis work: Luo Y
Designed the research work and provided guidance: Ai X
Availability of data and materialsNot applicable.
Financial support and sponsorshipNone.
Conflicts of interestBoth authors declared that there are no conflicts of interest.
Ethical approval and consent to participateNot applicable.
Consent for publicationNot applicable.
Copyright© The Author(s) 2022.
REFERENCES
1. Kabir E, Guikema S, Kane B. Statistical modeling of tree failures during storms. Reliab Eng Syst Saf 2018;177:68-79.
2. Hart E, Sim K, Kamimura K, Meredieu C, Guyon D, Gardiner B. Use of machine learning techniques to model wind damage to forests. Agric For Meteorol 2019;265:16-29.
3. Kamimura K, Gardiner B, Dupont S, Guyon D, Meredieu C. Mechanistic and statistical approaches to predicting wind damage to individual maritime pine (Pinus pinaster) trees in forests. Can J For Res 2015;46:88-100.
4. Gardiner B. Wind damage to forests and trees: a review with an emphasis on planted and managed forests. J For Res 2021;26:248-66.
5. James KR, Haritos N, Ades PK. Mechanical stability of trees under dynamic loads. Am J Bot 2006;93:1522-30.
6. Morgan J, Cannell MGR. Structural analysis of tree trunks and branches: tapered cantilever beams subject to large deflections under complex loading. Tree Physiol 1987;3:365-74.
7. Baker CJ. The development of a theoretical model for the windthrow of plants. J Theor Biol 1995;175:355-72.
8. Sellier D, Fourcaud T, Lac P. A finite element model for investigating effects of aerial architecture on tree oscillations. Tree Physiol 2006;26:799-806.
9. Moore JR, Maguire DA. Simulating the dynamic behavior of Douglas-fir trees under applied loads by the finite element method. Tree Physiol 2008;28:75-83.
10. Ciftci C, Arwade SR, Kane B, Brena SF. Analysis of the probability of failure for open-grown trees during wind storms. Probabilist Eng Mech 2014;37:41-50.
11. Ciftci C, Brena SF, Kane B, Arwade SR. The effect of crown architecture on dynamic amplification factor of an open-grown sugar maple (Acer saccharum L.). Trees Struct Funct 2013;27:1175-89.
12. Ai X, Cheng Y, Peng Y. Nonlinear dynamics and failure wind velocity analysis of urban trees. Wind Struct An Int J 2016;22:89-106.
13. Peng Y, Wang Z, Ai X. Wind-induced fragility assessment of urban trees with structural uncertainties. Wind Struct An Int J 2018;26:45-56.
14. Moravčík L, Vincúr R, Rózová Z. Analysis of the static behavior of a single tree on a finite element model. Plants 2021;10:1284.
15. Peltola H, Kellomäki S, Väisänen H, Ikonen VP. A mechanistic model for assessing the risk of wind and snow damage to single trees and stands of Scots pine, Norway spruce, and birch. Can J For Res 1999;29:647-61.
16. Gardiner B, Peltola H, Kellomäki S. Comparison of two models for predicting the critical wind speeds required to damage coniferous trees. Ecol Modell 2000;129:1-23.
17. Ancelin P, Courbaud B, Fourcaud T. Development of an individual tree-based mechanical model to predict wind damage within forest stands. For Ecol Manag 2004;203:101-21.
18. Gardiner B, Byrne K, Hale S, et al. A review of mechanistic modelling of wind damage risk to forests. Forestry 2008;81:447-63.
19. Federal Emergency Management Agency (FEMA). Multi-hazard Loss Estimation Methodology Hurricane Model Hazus®-MH 2.1 Technical Manual. 2012. Available from: https://www.fema.gov/sites/default/files/2020-09/fema_hazus_hurricane-model_technical-manual_2.1.pdf [Last accessed on 30 Nov 2022].
20. Achim A, Ruel JC, Gardiner BA, Laflamme G, Meunier S. Modelling the vulnerability of balsam fir forests to wind damage. For Ecol Manag 2005;204:37-52.
21. Jim CY, Liu HHT. Storm damage on urban trees in Guangzhou, China. Landsc Urban Plan 1997;38:45-59.
22. Haaften MA, Meuwissen MPM, Gardebroek C, Kopinga J. Trends in financial damage related to urban tree failure in the Netherlands. Urban For Urban Green 2016;15:15-21.
23. Gardiner B, Berry P, Moulia B. Review: wind impacts on plant growth, mechanics and damage. Plant Sci 2016;245:94-118.
24. Gu D, Zhao P, Chen W, Huang Y, Lu X. Near real-time prediction of wind-induced tree damage at a city scale: simulation framework and case study for Tsinghua University campus. Int J Disaster Risk Reduct 2021:53.
25. Max T, Burkhart H. Segmented polynomial regression applied to taper equations. For Sci 1976;22:283-9. Available from: https://academic.oup.com/forestscience/article-abstract/22/3/283/4675818 [last accessed on 17 Nov 2022]
26. Rautiainen M, Mõttus M, Stenberg P, Ervasti S. Crown envelope shape measurements and models. Silva Fenn 2008;42:19-33.
27. McPherson EG, van Doorn N, Peper PJ. Urban tree database and allometric equations. USDA Forest Service 2016.
28. Simiu E, Yeo DH. Wind effects on structures: modern structural design for wind. 4th ed. Hoboken: John Wiley & Sons. 2019.
29. Hou G, Chen S. Probabilistic modeling of disrupted infrastructures due to fallen trees subjected to extreme winds in urban community. Nat Hazards 2020;102:1323-50.
30. Davenport AG. The spectrum of horizontal gustiness near the ground in high winds. Quart J Roy Meteorol Soc 1961;87:194-211.
31. Ang AH-S, Tang WH. Probability concepts in engineering: emphasis on applications to civil and environmental engineering. 2nd ed. Hoboken: John Wiley & Sons. 2007.
32. Genest C, Favre AC. Everything you always wanted to know about copula modeling but were afraid to ask. J Hydrol Eng 2007;12:347-68.
33. Tao J, Chen J, Ren X. Copula-based quantification of probabilistic dependence configurations of material parameters in damage constitutive modeling of concrete. J Struct Eng 2020;146:04020194.
35. Sader SA. Forest biomass, canopy structure, and species composition relationships with multipolarization L-band synthetic aperture radar data. Photogramm Eng Remote Sensing 1987;53:193-202. Available from: http://www.asprs.org/wp-content/uploads/pers/1987journal/feb/1987_feb_193-202.pdf [last accessed on 17 Nov 2022]
36. Nicoll BC, Gardiner BA, Rayner B, Peace AJ. Anchorage of coniferous trees in relation to species, soil type, and rooting depth. Can J For Res 2006;36:1871-83.
37. Nicoll BC, Gardiner BA, Peace AJ. Improvements in anchorage provided by the acclimation of forest trees to wind stress. Forestry 2008;81:389-98.
38. Locatelli T, Tarantola S, Gardiner B, Patenaude G. Variance-based sensitivity analysis of a wind risk model - Model behaviour and lessons for forest modelling. Environ Model Softw 2017;87:84-109.
39. MHUDPRC (Ministry of Housing and Urban-Rural Development of the People’s Republic of China). Load code for the design of building structures. GB 50009-2012. Beijing: MHUDPRC; 2012. (in Chinese). Available from: https://www.mohurd.gov.cn/gongkai/fdzdgknr/tzgg/201207/20120723_210754.html [last accessed on 17 Nov 2022].
Cite This Article
Export citation file: BibTeX | RIS
OAE Style
Luo Y, Ai X. Wind risk assessment of urban street trees based on wind-induced fragility. Dis Prev Res 2022;1:7. http://dx.doi.org/10.20517/dpr.2022.05
AMA Style
Luo Y, Ai X. Wind risk assessment of urban street trees based on wind-induced fragility. Disaster Prevention and Resilience. 2022; 1(2): 7. http://dx.doi.org/10.20517/dpr.2022.05
Chicago/Turabian Style
Luo, Yi, Xiaoqiu Ai. 2022. "Wind risk assessment of urban street trees based on wind-induced fragility" Disaster Prevention and Resilience. 1, no.2: 7. http://dx.doi.org/10.20517/dpr.2022.05
ACS Style
Luo, Y.; Ai X. Wind risk assessment of urban street trees based on wind-induced fragility. Dis. Prev. Res. 2022, 1, 7. http://dx.doi.org/10.20517/dpr.2022.05
About This Article
Special Issue
Copyright

Data & Comments
Data


 Cite This Article 15 clicks

 Like This Article 20
likes
Like This Article 20
likes


Comments
Comments must be written in English. Spam, offensive content, impersonation, and private information will not be permitted. If any comment is reported and identified as inappropriate content by OAE staff, the comment will be removed without notice. If you have any queries or need any help, please contact us at support@oaepublish.com.