
Multi-dimensional dynamic simulation of rainstorm waterlogging in urban communities
 0
0 , ...
, ... Abstract
One major threat to cities at present is the increasing rainstorm waterlogging hazards due to climate change and accelerated urbanization. This paper explores the mechanism of rainstorm waterlogging and enables the fine simulation of surface water propagation over complex urban terrain. A novel community-scale waterlogging modeling scheme is presented by loosely coupling a one-dimensional sewer model with a two-dimensional overland model under an open-source framework. The coupled model was applied to Waigaoqiao Free Trade Zone located in Pudong New Area of Shanghai. To quantify the influence of rainfall intensity and drainage conditions on the waterlogging, 12 scenarios were constructed by combining four rainfall return periods (3, 5, 10, and 20 a) and three startup water depths (1.5, 2.0, and 2.5 m) of pump stations. The multi-scenario simulation results show that the waterlogging risk increases from north to south in the study area, and that risk zones with water depth above 0.3 m are mostly concentrated in the southwest and southeast corners of the site. The longer the rainfall return period, the larger the submerged area, and the spatial distribution of surface water accumulation is affected by local topography and drainage system. In addition, reducing the startup water depth of pump stations has an obvious effect on inhibiting the severity of water accumulation. The results provide insights into overland flow across an urban area with densely populated buildings and help to reduce the risk of rainstorm-induced waterlogging disasters.
Keywords
INTRODUCTION
With global warming and rapid urbanization, many cities in China often experience severe urban waterlogging caused by rainstorms, causing casualties and huge economic losses[1-3]. For example, on
Urban waterlogging refers to continuous or heavy rainfall in a short period that exceeds the urban drainage capacity, resulting in surface water accumulation that can not be eliminated in time[9]. Flood dynamics across urbanized areas are difficult to understand because of the complex urban infrastructures and underlying surface conditions and drainage systems, which play important roles in flood propagation and accumulation[10]. Urban waterlogging models, combined with geographic information system (GIS), realize numerical simulations of waterlogging areas and depths based on hydrology and hydrodynamic mathematical models. A hydrologic model is based on watershed hydrology, taking the city as a small or medium scale basin and dividing it into several sub-basins that are catchments[11]. Hydrologic models are black box models. Urban waterlogging simulations only contain the input of rainfall and the output of results and cannot describe the loss of flow and transport. Hydraulic models have certain physical meaning and can depict the flow dynamics in detail, but the solving process is complicated. In hydrodynamic simulations, the urbanized area is usually divided into many grids and connected with drainage channels such as the drainage network and river channels. GIS can perform catchment division, drainage system generalization, and parameter settings of rainstorm waterlogging[12,13].
Modeling urban waterlogging is difficult and challenging, in part due to the complex interaction between sewers and the aboveground area[10,14]. Many studies have applied the storm water management model (SWMM) to calculate the manhole surcharge and used the water stage-volume curve to determine the inundation depth[15-18]. SWMM provides an accurate simulation for urban surface runoff, pollution load, network planning of drainage pipes, and effect of low impact development facilities on rainfall quality and quantity[19]. However, a one-dimensional (1D) sewer model cannot effectively reflect the overland flow, so two-dimensional (2D) models based on shallow water equations or their simplified equations should be used to simulate the inundation extent and depth during a rainstorm[20,21]. Traditionally, 2D modeling attempts have been limited by the sparsity of topographic data and computer processing power[22]. The emergence of new data collection techniques and advances in computing technology have relaxed such constraints and made the application of hydraulic models to complex urban terrain where buildings are resolved possible.
Some commercial models, such as MIKE Urban[23], SOBEK[24], InfoWorks ICM[25], and PCSWMM[26], have realized the mass exchange between drainage systems and overland surface by coupling 1D/2D models[21,27]. Nevertheless, the majority of these models require expensive modules that somewhat limit their widespread usage. Limited attempts have been made to couple existing open-source 1D/2D hydraulic models to achieve high-resolution urban waterlogging simulation[14,28,29]. In the 1D/2D coupling framework, the open-source SWMM, known for being a simple but robust 1D sewer model, is one of the most commonly used rain flood models at present. For 2D model selection, raster-based 2D hydrodynamic models are preferable because they can be readily integrated with the digital elevation model (DEM), simplifying model setup and post-processing[29]. LISFLOOD-FP, a raster-based 2D model with relatively simple formulation, is easy to set up and run, computationally efficient, and has been demonstrated to be able to predict flood inundation[30].
Inspired by the above, this paper presents a simple approach for modeling rainstorm waterlogging in urban communities through loosely coupling SWMM with LISFLOOD-FP. Taking the Waigaoqiao Free Trade Zone (WFTZ) located in Pudong New Area of Shanghai as the study site, a high-resolution community waterlogging model is constructed based on the proposed approach. A multi-scenario simulation was performed to predict the inundation area and depth under different recurrence periods of rainfall and different pumping conditions.
The remainder of this article is organized as follows. The models used and coupling methods are introduced in the next section. Then, model setup and applications are presented, followed by the results and a discussion. Finally, the conclusions are drawn.
METHODS
The numerical simulation of urban rainstorm waterlogging includes rainfall-runoff simulation, 1D sewer network simulation, and 2D overland flow simulation. The results from the hydrological rainfall-runoff simulation are used as inputs to the 1D model at specified manholes (junction nodes) of the sewer network. When the capacity of the pipe network is exceeded, excess flow spills from the manholes into the domain of the 2D model[31].
Design rainfall
In the waterlogging model, rainfall should be input by the actual rainfall, but it can also assume certain scenarios based on flood control standards when there are no measured data. According to the code for design of outdoor wastewater engineering, the formula of rainstorm intensity is defined as follows:

where q is the design storm intensity, L/s·ha; A is rainfall, mm; C is the variation parameter of rainfall, which is one of the parameters reflecting the variation degree of rainfall intensity in different recurrence periods; t is rainfall duration, min; P is the design rainfall recurrence periods, a; and b and n are constants, which reflect the change of rainfall intensity over time.
According to rainstorm intensity formula and design rainstorm profile of Shanghai, the intensity of a short-duration rainstorm is calculated by the following formula:

The short-duration rainstorm is expressed by the rainstorm intensity formula and the rain peak coefficient. When the rainstorm recurrence period is 2-100 a, the rain peak coefficient is 0.405.
Sewer network simulation
SWMM was developed by the United States Environmental Protection Agency as the first comprehensive urban runoff analysis model. It is suitable for the construction of pipeline hydraulic models and is characterized by a more selective runoff generation and concentration model and a more intuitive display of dynamic results. In SWMM, the urban drainage network system is generalized into three types: pipeline, node, and sub-catchment area. In the calculation, the Horton model, Green-Ampt model, and SCS curve number infiltration method are used to calculate the surface runoff. The nonlinear reservoir principle is used to simulate the surface confluence, while the Saint-Venant equations are used to solve the pipe flow dynamics.
The 1D pipe flow routing in SWMM is calculated by the conservation of mass and conservation of energy formulas.


where Q is the discharge of the pipe, m3/s; A is the wet cross-sectional area of the pipe, m2; t is time, s; x is the length along the water direction, m; H is the hydraulic head of water in the conduit, m; g is the acceleration of gravity, m/s2; and Sf is the friction slope (head loss per unit length).
The friction slope Sf can be expressed in terms of the Manning equation:

where n is the Manning roughness coefficient, s/m1/3; R is the hydraulic radius of the flow cross-section, m; and U is the velocity, equal to Q/A, m/s. The use of the absolute value sign on the velocity term makes Sf a directional quantity (since Q can be either positive or negative) and ensures that the frictional force always opposes the flow.
Overland flow simulation
The 2D hydrodynamic simulation of the surface inundation is usually implemented by solving shallow water equations, which are based on the depth-averaged Navier-Stokes equations. These equations assume that the flow is mainly in the horizontal direction, while the flow rate changes in the vertical direction are negligible.
LISFLOOD-FP is a raster-based inundation model specifically developed to take advantage of high-resolution topographic datasets[32]. It is capable of realizing simulation of 1D channel flow and 2D floodplain flow and has been widely used to create reach- and regional scale-flood inundation extents[33-35]. Some studies[36-38] have shown that the LISFLOOD-FP model can also be used to simulate the rain flood dynamics across urbanized areas after improvement, and it has higher computational efficiency. The mathematical expressions of 2D floodplain flows are similarly described in terms of continuity and momentum equations, discretized over a grid of square cells, which allows the model to present 2D dynamic flow fields on the floodplain. Treating each cell as a storage volume, the change in cell volume over time is equal to the fluxes into and out of it during the time step[32]:

where V is the cell volume, m3; t is the time, s; and Qleft, Qright, Qup and Qdown are the flowrates (either positive or negative) from the left, right, upstream, and downstream adjacent cells, respectively, m3/s.
The flowrates between two adjacent cells i and j can be calculated using the Manning equation:

where Qij is the flux between cells i and j, m3/s; Aij is the cross sectional area at the interface of the two cells, m2; Rij is the hydraulic radius at the interface of the two cells, m; Sij is the water surface slope between the two adjacent cells; and n is the Manning friction coefficient, s/m1/3.
To ensure model stability, we use an adaptive time step based on the Courant-Friedrichs-Lewy (CFL) condition, which is estimated as[30]

where α is a coefficient rating from 0.3 to 0.7 that ensures numerical stability.
Model coupling
In the community waterlogging model, the hydrological rainfall-runoff process and flow routing in pipelines are performed through the SWMM model, while the 2D overland flow simulation is carried out with the LISFLOOD-FP model. Considering the computational inefficiency of the bidirectional coupling scheme, a one-way loose coupling scheme is adopted in this article. That is, when the rainfall intensity exceeds the drainage capacity of the sewer network, the surcharged flows spill onto the ground surface from manholes. The 1D and 2D hydrodynamic models are linked at the manholes where the overflow occurred. Considering the lack of data acquisition and interaction capabilities during EPA SWMM simulation, a third-party open-source library, PySWMM[39], is used to obtain the discharges from manholes at each time step. Then, the discharges are fed as the point source boundary conditions to drive the floodplain simulation with LISFLOOD-FP. Both SWMM and LISFLOOD-FP are executed in stand-alone mode. The time step of SWMM is fixed, while that of LISFLOOD-FP is variable and adaptive. To ensure the two models exchange information properly, for each execution, the simulation time of LISFLOOD-FP is adjusted and equivalent to the time step of SWMM. This method can make full use of the advantages of both models to quickly calculate the overflow of the drainage network and simulate the inundation range and depth on the surface.
MODEL SETUP AND APPLICATION
Case study
Site description
Shanghai is one of the largest seaports in the world and a major industrial and commercial center of China. It is located in the estuary of the Yangtze River and is adjacent to the East China Sea. Influenced by the humid subtropical monsoon climate, Shanghai is rich in rainfall, with an average annual rainfall of
We choose the core block of WFTZ for the case study. WFTZ was approved by The State Council of China in June 1990 with a planned area of 10 km2. It is the first trade zone with the largest economic volume in China. It is located in the north of Pudong New Area, near the mouth of the Yangtze River. The study site covers an area of 8.33 km2 in a triangular shape, as shown in Figure 1. The study site is low-lying and has clear and accessible boundary conditions. The west is bounded by Yanggao North Road, the south by Wuzhou Avenue, and the east side by the Outer Ring Canal, which is connected to the Yangtze River and influenced by the tides of the estuary.
Figure 1. Location of study site.
Datasets
Basic data in the study site mainly include the topographic map, satellite image, elevation control points, roads, green lands, buildings, water systems, inspection wells, drainage pipe network, and pump stations of WFTZ. The DEM data of the study area were obtained from the BIGEMAP map downloader[41] with a resolution of 1 m. The data on the drainage network in 2017 and land cover in 2020 were obtained from the municipal urban construction management department. According to the survey, the pipelines in the study area were mostly laid before 2000, and the drainage network has not been systematically renovated and maintained since 2010. Considering the influence of buildings on the distribution of waterlogging, the ground elevation of the study area was modified by overlapping buildings and DEM in ArcGIS. Precipitation data were sourced from the 1 min precipitation process data at the Waigaoqiao Rainfall Monitoring Station on 8 July 2021.
Model setup
According to the basic data in WFTZ, such as topographic map, drainage network diagram, and land use types, through the sub-catchment division of the study area, drainage network system generalization, and parameter determination, we built a waterlogging model on the basis of SWMM.
Model generalization
Firstly, according to the road boundaries and drainage network topology, the study area was coarsely divided into three catchment areas (A-C) from north to south, with corresponding areas of 22.5, 226.7, and 583.3 ha, respectively. Then, the three catchments were further divided into the smaller sub-catchments using Voronoi tessellation, ensuring that each sub-catchment area corresponds to an inspection well (manhole) as the interaction point between the surface catchment and pipe network. There are four pump stations along the east boundary of the study area. The stormwater in the study area is mainly pumped by these four pump stations and discharged through the Outer Ring Canal. Figure 2 shows the generalization of the drainage network and sub-catchments. Due to the complexity of underground pipe network, we neglected some of the pipes, which are branch pipes with a shorter length or located at the start of the pipeline. The pipe network is mainly distributed along the main roads, and the drainage network was ultimately generalized as follows: 4 outlets, 1649 nodes, and 1704 conduits. The largest sub-catchment area is 4.0 ha, the smallest is 0.02 ha, and the average area is about 0.5 ha.
Figure 2. Drainage network generalization and catchment division.
Parameter determination
Model parameters can be divided into two categories: measured parameters and empirical parameters. The measured parameters include sub-catchment area, average slope, impervious rate, the bottom elevation and depth of the node, the length and slope of the pipeline, etc., which can be obtained through basic data processing and calculation with ArcGIS. The empirical parameters that cannot be obtained directly include the characteristic width of sub-catchment area, Manning coefficient of pervious and impervious area, depression storage quantity of pervious and impervious area, and the maximum and minimum infiltration rate of the Horton model. Among them, the characteristic width of sub-catchment is defined as the ratio of the area of sub-catchment to the length of the longest path of surface diffuse flow. To improve the calculation feasibility, the empirical formula is generally used to calculate them, and the square root of the sub-catchment area is taken as the characteristic width in this paper. The rest of the empirical parameters refer to the user manual of SWMM model[42].
Due to the lack of measured data for validation, the runoff coefficient method[43] is used to preliminarily calibrate the model parameters in this paper. The model calibration idea of the runoff coefficient method is to use the runoff coefficient as the objective function for model parameter calibration, especially to compare the a priori comprehensive runoff coefficient used for sewer network design with the comprehensive runoff coefficient simulated by the computer model for model parameter calibration. The measured “2021.7.8” rainfall process is input for parameter calibration. After adjusting the parameters, the comprehensive runoff coefficient of this regional rainfall event is 0.55, basically consistent with the empirical value in the drainage design specification. The final calibration results are shown in Table 1.
Parameters of the model
| Parameter name | Parameter description | Value |
| N-Imperv | Manning factor of impervious area | 0.012 |
| N-Perv | Manning factor of pervious area | 0.24 |
| D-Imperv | Depression storage of impervious area | 1.904 mm |
| D-Perv | Depression storage of pervious area | 3.81 mm |
| MaxRate | Maximum infiltration rate | 76.2 mm/h |
| MinRate | Minimum infiltration rate | 2.54 mm/h |
| Decay | Attenuation coefficient | 6 |
Figure 3 shows the precipitation histogram of the “2021.7.8” rainfall process and the flow curves of the outlets in the study area. Corresponding to the smallest catchment Area A, the flow rate of Outlet 1 is obviously smaller than that of the three other outlets. However, it can be found that the flow process of the four outlets has similar characteristics, and that peak flow occurred about 15 min after the precipitation peak, which is consistent with the general law of urban rainfall flooding. This indicates that the simulation results are basically reliable.
Figure 3. Comparison diagram of outlet discharge and precipitation in the study area.
Scenario design
We simulated and analyzed the effects of precipitation intensity and pumping conditions on urban waterlogging during short-duration rainstorms. Combining different precipitation return periods (P = 3, 5, 10, 20 a) and pump station startup water depths (H = 1.5, 2.0, 2.5 m), 12 simulation scenarios were constructed.
Based on the rainstorm intensity formula in Shanghai, the rainfall in the return periods of 3, 5, 10, and 20 a were calculated, and the rainfall duration is 120 min. Figure 4 shows the rainfall intensity for different return periods, and the related rainfall parameters are shown in Table 2.

Figure 4. Design rainfall during different return periods.
Maximum rainfall intensity and accumulated rainfall during different return periods
| Return period (a) | Peak rainfall intensity (mm/min) | 2 h rainfall (mm) |
| 3 | 2.67 | 48.24 |
| 5 | 3.75 | 67.95 |
| 10 | 4.25 | 76.77 |
| 20 | 5.62 | 101.34 |
In addition to rainfall intensity, different drainage conditions were also considered in the scenario design. At present, the default startup water depth of 2.5 m is set for the four pump stations of WFTZ. To optimize the operational efficiency of the pump stations during the rainstorm, three different water depths, 1.5, 2.0, and 2.5 m, were set to simulate and analyze the spatial distribution of waterlogged areas.
RESULTS AND DISCUSSION
Statistics of simulated water depth and submerged area
Based on the above methods, 12 scenarios of rainstorm waterlogging in the study were simulated. Table 3 presents the statistical results of maximum inundation depth and water accumulation area for 12 scenarios. To quantitatively analyze the impact of waterlogging, the affected area was further divided into four grades based on water depth: slight (5-15 cm), moderate (15-30 cm), serious (30-50 cm), and severe (> 50 cm). In addition, the affected areas corresponding to different grades were also calculated. Waterlogging with a depth of less than 5 cm was ignored, as it does not cause significant adverse effects on travel.
Maximum inundation depth and corresponding area in each scenario
| Scenario No. | Startup water depth H (m) | Return period P (a) | Submerged area (ha) | ||||
| 5-15 cm | 15-30 cm | 30-50 cm | > 50 cm | Total | |||
| I | 1.5 | 3 | 172.92 | 90.21 | 2.80 | 0.00 | 265.93 |
| II | 5 | 205.96 | 110.39 | 28.16 | 0.01 | 344.52 | |
| III | 10 | 210.99 | 155.95 | 55.08 | 0.01 | 422.03 | |
| IV | 20 | 201.39 | 205.98 | 77.88 | 0.02 | 485.27 | |
| V | 2.0 | 3 | 168.29 | 119.52 | 18.53 | 0.00 | 306.34 |
| VI | 5 | 187.51 | 128.62 | 52.54 | 0.01 | 368.68 | |
| VII | 10 | 196.88 | 171.04 | 76.35 | 0.02 | 444.29 | |
| VIII | 20 | 178.50 | 201.60 | 115.95 | 0.62 | 496.67 | |
| IX | 2.5 | 3 | 166.16 | 130.92 | 24.41 | 0.00 | 321.48 |
| X | 5 | 185.12 | 134.44 | 60.06 | 0.01 | 379.63 | |
| XI | 10 | 186.46 | 168.22 | 97.48 | 0.02 | 452.18 | |
| XII | 20 | 169.11 | 205.34 | 124.75 | 6.20 | 505.40 | |
Spatial distribution characteristics of waterlogging
Based on the simulated water depth of each grid, the spatial interpolation and visualization tools embedded in ArcGIS software were used to render the numerical results, so as to intuitively reveal the spatial distribution characteristics of waterlogging.
Figure 5 shows the spatial distribution of simulated water depth at two typical moments of Scenario VII. The study area is densely populated with buildings and has a high impermeable rate, which is prone to water accumulation due to heavy rain. As shown in Figure 5A, surface water accumulation is mainly affected by the elevation and local drainage network. In the middle study area, waterlogging spots with a simulated depth of more than 15 cm are mainly distributed along Hanjin Road. It is the inner boundary between catchment Areas B and C, where the underground drainage networks are physically separated. When experiencing heavy rain with a return period of 20 a, a wide range of water accumulation is easy to form in the southern study area, especially in the south of Zhouhai Road. Heavy waterlogging spots with a water depth of more than 30 cm are distributed in the low depressions along Yinglun Road, Debao Road, and Fasai Road.
Figure 5. Simulated depth distribution of Scenario VII (P = 10 a, H = 2.0 m): (A) surface water depth distribution at t = 60 min; and
The spatial distribution of surface water accumulation in the study area changes dynamically as the torrential rain continues. By comparing Figure 5A and B, it can be seen that, after another half hour of heavy rain, in the middle study site, the surface water west of Fute Road gradually expands and spreads to the east. This is influenced by the local topography and drainage direction. In addition, the simulated water depth is further increasing in the southern study site, especially at both ends of Debao Road and the west section of Yinglun Road. It suggests that the designed drainage capacity in this site is insufficient to cope with heavy rain with a 10-year return period. In addition, there are only four rainwater pump stations in the study area, which are all deployed on the east boundary of the site. The surface flooding in the south of the study area, especially in the southwest corner, cannot be drained in time.
Impact of rainfall intensity
To explore the impact of rainfall intensity on urban waterlogging, the simulation results of four scenarios (V-VIII) are compared and analyzed in this subsection. Figure 6 presents the simulated inundated area and water depth distribution at the peak stage under four precipitation recurrence periods (P = 3, 5, 10, 20 a). The startup water depths of pump stations are all set to 2.0 m in these four scenarios.
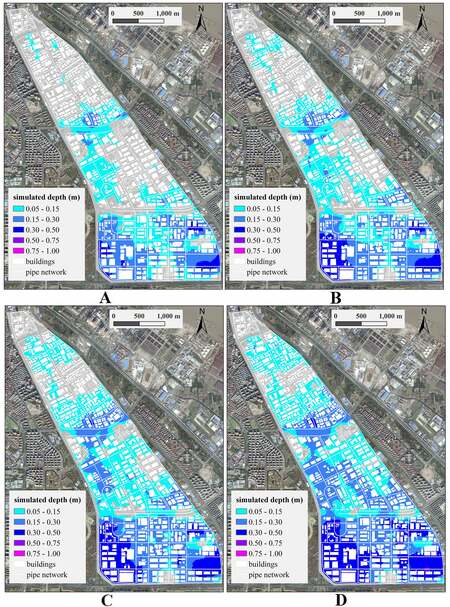
Figure 6. Comparison of water depth distribution in different rainfall return periods: (A) water depth distribution of Scenario V (P = 3 a, H = 2.0 m); (B) water depth distribution of Scenario VI (P = 5 a, H = 2.0 m); (C) water depth distribution of Scenario VII (P = 10 a,
Figure 6 shows that the spatial distribution of surface water accumulation in the study area is similar under the four different rainfall return periods. The catchment area in the northern study site is relatively small, and the drainage capacity is obviously stronger than that in the middle and southern parts, and waterlogging does not easily occur. Most of the waterlogged areas are less than 30 cm deep. The serious areas with water depths above 30 cm are mostly located in the southern study area.
As illustrated in Figure 6 and Table 3, in case of Scenario V, the area affected by waterlogging in the study area is 306.34 ha, within which the serious area is 18.53 ha, accounting for about 6% [Figure 6A]. With the increase in rainfall intensity, the total submerged area and the area and proportion of serious zone also increase gradually [Figure 6B-D]. When P = 20 a, the three corresponding values increase to 496.67 ha, 115.95 ha, and 23.35%, respectively.
In addition, the overflow process of the drainage network during the rainstorm was also investigated. The overflow process under different precipitation recurrence periods is depicted in Figure 7 for a representative manhole (the control point shown in Figure 2) in the southwest corner of the site. The area of the upper sub-catchments of this manhole is about 2.6 ha. The result shows that the nodal overflow pattern is similar for different recurrence periods, and that the overflow rate reaches the maximum after the heavy rain lasts for about 55 min. Compared with the designed rainfall histogram illustrated in Figure 4, the time of peak overflow is slightly lagged behind the time of peak precipitation. The overflow does not decline rapidly after the peak. Moreover, the longer the rainfall return period, the more obvious the lag effect of the overflow decrease.
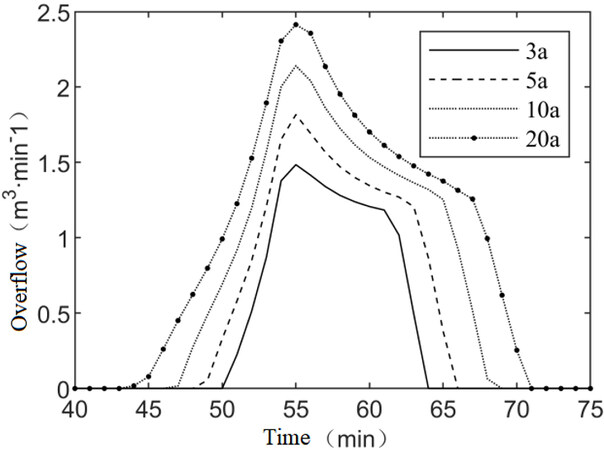
Figure 7. Simulated overflow from a typical node under different return periods.
Impact of pumping conditions
The stormwater in the study site is mostly pumped by four pump stations deployed along the eastern boundary and discharged through the Outer Ring Canal. Therefore, the working conditions of the pump stations have a direct impact on flood control and waterlogging removal. At present, the on/off status of the four pump stations is controlled dynamically by defining startup and shutoff water depths at the inlet nodes. We quantified the influence of startup water depth on waterlogging distribution in the study area through scenario-based simulation analysis.
For each scenario, based on the confluence simulation of the drainage network, the pump utilization rate was calculated with the pump usage time and flow rate. As shown in Table 4, among the four pumps at the site, Pump 3 usually has the highest utilization efficiency in the scenarios, followed by Pump 2. When the rainfall return period increases or the startup water depth decreases, the utilization rate of each pump station is improved to a certain extent.
Percentage of water pump utilization under different conditions (%)
| Scenario No | H/m | P/a | Pump utilization rate/% | |||
| Pump #1 | Pump #2 | Pump #3 | Pump #4 | |||
| I | 1.5 | 3 | 85.05 | 87.96 | 90.67 | 84.82 |
| II | 5 | 86.2 | 88.89 | 91.3 | 85.86 | |
| III | 10 | 87.15 | 89.74 | 91.98 | 87.07 | |
| IV | 20 | 88.75 | 90.44 | 92.53 | 88.2 | |
| V | 2.0 | 3 | 84.5 | 86.22 | 89.99 | 84.62 |
| VI | 5 | 84.73 | 87.21 | 90.68 | 85.67 | |
| VII | 10 | 86.64 | 88.39 | 91.52 | 86.84 | |
| VIII | 20 | 87.15 | 89.33 | 92.18 | 87.82 | |
| IX | 2.5 | 3 | 82.74 | 84.52 | 89.18 | 84.31 |
| X | 5 | 84.04 | 85.62 | 90.08 | 85.44 | |
| XI | 10 | 85.28 | 86.79 | 90.91 | 86.62 | |
| XII | 20 | 86.21 | 87.63 | 91.6 | 87.67 | |
Figure 8 shows the simulated water depth distribution of six scenarios. Figure 8A-C shows the spatial distribution of simulated water depth with different startup water depths (1.5, 2.0, and 2.5 m) under a five-year design precipitation. By comparison, it was found that the overall distribution of waterlogging area is not greatly affected under the same precipitation recurrence period, but different pump startup water depths affect the severity of water accumulation in the site. As illustrated in Figure 8D-F, this phenomenon is more obvious under the 20-year design rainfall. When the startup water depth of the pump station increases from 1.5 to 2.5 m, the proportion of serious areas in the southern study area increases significantly, and the severe zone with a water depth of 0.5-0.75 m appears in the southeast corner of the site [Figure 8F].
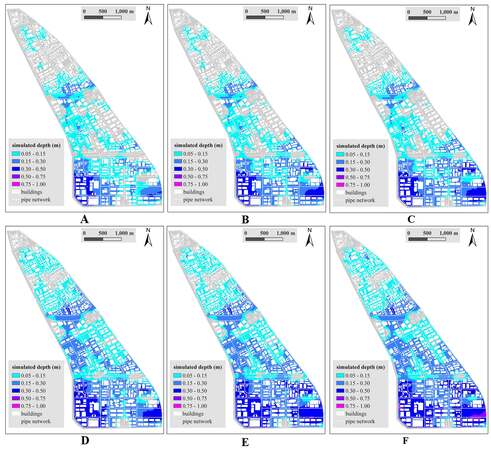
Figure 8. Comparison of water depth distribution with different pump startup water depths: (A) water depth distribution of Scenario II
Assuming that the rainfall return period remains unchanged, it can also be seen from the results in Table 3 that the submerged area in the study area decreases correspondingly when the startup water depth of the pump station is reduced. Especially for the submerged area with a water depth above 30 cm, this measure has a significant inhibition effect. For example, for the 10-year return period, when the startup water depth H drops from 2.5 to 2.0 m, the total submerged area reduces from 452.18 to 444.29 ha, and the serious area reduces from 97.48 to 76.35 ha (1.74% and 21.68%, respectively). When H is reduced from 2.5 to 1.5 m, the decline rates of the total submerged area and the serious area are 6.67% and 43.53%, respectively.
Therefore, it is necessary to lower the startup water depth of the pump stations to minimize the risk of waterlogging disaster when the site encounters a rainstorm with a ≥ 10-year return period. Given the high risk of waterlogging in the southern study area and the lack of waterlogging removal capacity, management should consider deploying new pump stations or upgrading the capacity of existing pump stations to improve disaster resistance. Most of the drainage pipes in the study area are more than 20 years old. The design and layout of the pipe network can be further optimized, especially through the integration and optimization of the pipe networks in the lower half of the area, to improve the joint operation efficiency of Pumps 3 and 4. If necessary, an additional pumping station could be added in the lower right corner of the study site, near Debao Road/Fute East Road, to enhance the drainage capacity.
CONCLUSION
The demand for refined numerical simulations of urban waterlogging is stronger than ever before due to rapid urbanization and climate change that have already led to increased waterlogging risk across the world. In this context, scenario-based simulation analysis of urban rainstorm waterlogging has important theoretical and practical significance for waterlogging disaster warning and response and drainage facilities planning and maintenance. This paper presents a loosely coupled hydrodynamics approach for predicting rainstorm-induced waterlogging in urban communities. In the coupled model framework, the calculation of runoff generation and confluence, as well as 1D drainage network simulation, is implemented based on SWMM, while LISFLOOD-FP deals with 2D flow routing across an urbanized area. The interaction between a 1D sewer network and a 2D urban surface is made by mass transfer at the connecting nodes.
According to the characteristics of storm waterlogging in Shanghai, taking WFTZ as the study area, a community-scale waterlogging model is constructed based on the proposed approach. To quantify the impact of rainfall intensity and pumping condition on waterlogging, 12 scenarios were constructed by combining four rainfall return periods (3, 5, 10, and 20 a) and three pump startup water depths (1.5, 2.0, and 2.5 m). Then, a multi-scenario simulation was carried out to predict the spatial distribution of surface water accumulation, and the affected areas were classified according to the ponding depth.
The simulation results of the 12 scenarios show that the waterlogging risk increases from north to south in the study area. The risk zones with water depth above 0.3 cm are mainly located in the southeast and southwest corners of the study area. This is basically consistent with the survey results of waterlogging spots. As the rainfall return period increases, so does the surface submerged area and water depth. In addition, stormwater in the study area is mainly pumped and discharged by pump stations. When the return period of rainfall remains unchanged, lowering the startup water depth of the pump station has an inhibitory effect on the distribution of risk zones. At present, the startup water depths of four pumps in the study site are all set to 2.5 m. It is appropriate to lower the startup water depths to 1.5 m when facing a rainstorm with 10 a or longer recurrence period. In view of the higher risk of waterlogging in the southern study area and the insufficient waterlogging removal capacity of existing drainage facilities, planning and deployment of new pump stations should also be considered.
It is worth noting that, due to the lack of suitable observation data, the parameter calibration and verification of the coupled model are not sufficient. In addition, the influence of the rising water level of the adjacent Outer Ring Canal on drainage is not taken into account in the process of model construction. Subsequent studies will further verify and optimize the model, and we plan to combine 3D GIS and urban infrastructure data to improve dynamic visualization and comprehensive risk analysis capabilities.
DECLARATIONS
AcknowledgmentsThe authors thank the anonymous reviewers for their constructive comments and valuable suggestions.
Authors’ contributionsConceptualization, methodology, writing, funding acquisition, review: Zheng M
Methodology, data analysis and interpretation: Liu J, Yao S
Data curation and visualization: Gao J
Research guide, review, and material support: Jiang S, Zhou N
Availability of data and materialsNot applicable.
Financial support and sponsorshipThis work was supported by the Shanghai Science and Technology Innovation Action Plan Program, China (No. 21DZ1201205).
Conflicts of interestAll authors declareds that there are no conflicts of interest.
Ethical approval and consent to participateNot applicable.
Consent for publicationNot applicable.
Copyright© The Author(s) 2022.
REFERENCES
1. Yin J, Ye M, Yin Z, Xu S. A review of advances in urban flood risk analysis over China. Stoch Environ Res Risk Assess 2015;29:1063-70.
2. Zhang J, Wang Y, He R, Hu Q. Discussion on the urban flood and waterlogging and causes analysis in China. Adv Water Sci 2016;27:485-91 (In Chinese).
3. Lin T, Liu X, Song J, et al. Urban waterlogging risk assessment based on internet open data: A case study in China. Habitat Int 2018;71:88-96.
4. Yin J, Yu D, Yin Z, Liu M, He Q. Evaluating the impact and risk of pluvial flash flood on intra-urban road network: a case study in the city center of Shanghai, China. J Hydrol 2016;537:138-45.
5. Lyu HM, Sun WJ, Shen SL, Arulrajah A. Flood risk assessment in metro systems of mega-cities using a GIS-based modeling approach. Sci Total Environ 2018;626:1012-25.
6. Hou J, Du Y. Spatial simulation of rainstorm waterlogging based on a water accumulation diffusion algorithm. Geomat Nat Haz Risk 2020;11:71-87.
7. Tran D, Xu D, Dang V, Alwah A. Predicting urban waterlogging risks by regression models and internet open-data sources. Water 2020;12:879.
8. Chen Z, Li K, Du J, Chen Y, Liu R, Wang Y. Three-dimensional simulation of regional urban waterlogging based on high-precision DEM model. Nat Hazards 2021;108:2653-77.
9. Zhou M, Feng X, Liu K, Zhang C, Xie L, Wu X. An alternative risk assessment model of urban waterlogging: a case study of Ningbo city. Sustainability 2021;13:826.
10. Leandro J, Schumann A, Pfister A. A step towards considering the spatial heterogeneity of urban key features in urban hydrology flood modelling. J Hydrol 2016;535:356-65.
11. Song LX, Xu ZX. Coupled hydrologic-hydrodynamic model for urban rainstorm water logging simulation: recent advances. Nat Sci 2019; 55:581-587 (In Chinese).
12. Pandey AC, Singh SK, Nathawat MS. Waterlogging and flood hazards vulnerability and risk assessment in Indo Gangetic plain. Nat Hazards 2010;55:273-89.
13. Dang ATN, Kumar L. Application of remote sensing and GIS-based hydrological modelling for flood risk analysis: a case study of District 8, Ho Chi Minh city, Vietnam. Geomat Nat Haz Risk 2017;8:1792-811.
14. Wu X, Wang Z, Guo S, Liao W, Zeng Z, Chen X. Scenario-based projections of future urban inundation within a coupled hydrodynamic model framework: a case study in Dongguan City, China. J Hydrol 2017;547:428-42.
15. Zhang S, Pan B. An urban storm-inundation simulation method based on GIS. J Hydrol 2014;517:260-8.
16. Zhou QQ, Wang HP, Xu MM, Chen CB. A simplified GIS-based hydrological modelling approach for rapid flood risk assessment. China Water Wastewate ;31:109-13 (In Chinese).
17. Huang M, Jin S. A methodology for simple 2-D inundation analysis in urban area using SWMM and GIS. Nat Hazards 2019;97:15-43.
18. Meng X, Zhang M, Wen J, et al. A simple GIS-based model for urban rainstorm inundation simulation. Sustainability 2019;11:2830.
19. Gironás J, Roesner LA, Rossman LA, Davis J. A new applications manual for the Storm Water Management Model (SWMM). Environ Model Softw 2010;25:813-4.
20. Chang T, Wang C, Chen AS. A novel approach to model dynamic flow interactions between storm sewer system and overland surface for different land covers in urban areas. J Hydrol 2015;524:662-79.
21. Teng J, Jakeman A, Vaze J, Croke B, Dutta D, Kim S. Flood inundation modelling: a review of methods, recent advances and uncertainty analysis. Environ Model Softw 2017;90:201-16.
22. Fewtrell TJ, Bates PD, Horritt M, Hunter NM. Evaluating the effect of scale in flood inundation modelling in urban environments. Hydrol Process 2008;22:5107-18.
23. Bisht DS, Chatterjee C, Kalakoti S, Upadhyay P, Sahoo M, Panda A. Modeling urban floods and drainage using SWMM and MIKE URBAN: a case study. Nat Hazards 2016;84:749-76.
24. Bruni G, Reinoso R, van de Giesen NC, Clemens FHLR, Ten Veldhuis JAE. On the sensitivity of urban hydrodynamic modelling to rainfall spatial and temporal resolution. Hydrol Earth Syst Sci 2015;19:691-709.
25. Chen W, Huang G, Zhang H. Urban stormwater inundation simulation based on SWMM and diffusive overland-flow model. Water Sci Technol 2017;76:3392-403.
26. Abdelrahman YT, Moustafa AME, Elfawy M. Simulating flood urban drainage networks through 1D/2D model analysis. J Water Manag Model 2018;26:C454.
27. Salvadore E, Bronders J, Batelaan O. Hydrological modelling of urbanized catchments: a review and future directions. J Hydrol 2015;529:62-81.
28. Leandro J, Martins R. A methodology for linking 2D overland flow models with the sewer network model SWMM 5.1 based on dynamic link libraries. Water Sci Technol 2016;73:3017-26.
29. Paz AR, Serra LS, Silva MRDF, Meller A. Reducing computational runtime of two-dimensional urban inundation model by dynamic domain reshaping. J Hydrol Eng 2016;21:04016013.
30. Bates PD, Horritt MS, Fewtrell TJ. A simple inertial formulation of the shallow water equations for efficient two-dimensional flood inundation modelling. J Hydrol 2010;387:33-45.
31. Seyoum SD, Vojinovic Z, Price RK, Weesakul S. Coupled 1D and noninertia 2D flood inundation model for simulation of urban flooding. J Hydraul Eng 2012;138:23-34.
32. Bates P, De Roo A. A simple raster-based model for flood inundation simulation. J Hydrol 2000;236:54-77.
33. Biancamaria S, Bates PD, Boone A, Mognard NM. Large-scale coupled hydrologic and hydraulic modelling of the Ob river in Siberia. J Hydrol 2009;379:136-50.
34. Der Knijff JM, Younis J, De Roo APJ. LISFLOOD: a GIS-based distributed model for river basin scale water balance and flood simulation. Int J Geograp Inf Sci 2010;24:189-212.
35. Rajib A, Liu Z, Merwade V, Tavakoly AA, Follum ML. Towards a large-scale locally relevant flood inundation modeling framework using SWAT and LISFLOOD-FP. J Hydrol 2020;581:124406.
36. Fewtrell TJ, Duncan A, Sampson CC, Neal JC, Bates PD. Benchmarking urban flood models of varying complexity and scale using high resolution terrestrial LiDAR data. Phys Chem Earth 2011;36:281-91.
37. Neal J, Schumann G, Fewtrell T, Budimir M, Bates P, Mason D. Evaluating a new LISFLOOD-FP formulation with data from the summer 2007 floods in Tewkesbury, UK. J Flood Risk Manag 2011;4:88-95.
38. Sampson CC, Bates PD, Neal JC, Horritt MS. An automated routing methodology to enable direct rainfall in high resolution shallow water models. Hydrol Process 2013;27:467-76.
39. Mcdonnell B, Ratliff K, Tryby M, Wu J, Mullapudi A. PySWMM: the python interface to stormwater management model (SWMM). J Open Source Softw 2020;5:2292.
40. Shi Y, Shi C, Xu S, Sun A, Wang J. Exposure assessment of rainstorm waterlogging on old-style residences in Shanghai based on scenario simulation. Nat Hazards 2010;53:259-72.
41. BIGEMAP. Available from: http://www.bigemap.com/ [Last accessed on 8 Nov 2022].
42. Rossman LA, Simon MA. Storm water management model user’s manual version 5.2. Washington, DC: United States Environmental Protection Agency; 2022. pp. 206-21.
Cite This Article
Export citation file: BibTeX | RIS
OAE Style
Zheng M, Liu J, Yao S, Gao J, Jiang S, Zhou N. Multi-dimensional dynamic simulation of rainstorm waterlogging in urban communities. Dis Prev Res 2022;1:6. http://dx.doi.org/10.20517/dpr.2022.04
AMA Style
Zheng M, Liu J, Yao S, Gao J, Jiang S, Zhou N. Multi-dimensional dynamic simulation of rainstorm waterlogging in urban communities. Disaster Prevention and Resilience. 2022; 1(2): 6. http://dx.doi.org/10.20517/dpr.2022.04
Chicago/Turabian Style
Zheng, Maohui, Junbing Liu, Shuai Yao, Jinwei Gao, Simin Jiang, Nianqing Zhou. 2022. "Multi-dimensional dynamic simulation of rainstorm waterlogging in urban communities" Disaster Prevention and Resilience. 1, no.2: 6. http://dx.doi.org/10.20517/dpr.2022.04
ACS Style
Zheng, M.; Liu J.; Yao S.; Gao J.; Jiang S.; Zhou N. Multi-dimensional dynamic simulation of rainstorm waterlogging in urban communities. Dis. Prev. Res. 2022, 1, 6. http://dx.doi.org/10.20517/dpr.2022.04
About This Article
Special Issue
Copyright

Data & Comments
Data
0

 Cite This Article 36 clicks

 Like This Article 8
likes
Like This Article 8
likes


Comments
Comments must be written in English. Spam, offensive content, impersonation, and private information will not be permitted. If any comment is reported and identified as inappropriate content by OAE staff, the comment will be removed without notice. If you have any queries or need any help, please contact us at support@oaepublish.com.