
A statistics and physics-based tropical cyclone full track model for catastrophe risk modeling

Abstract
Catastrophe (CAT) risk modeling of perils such as typhoon and earthquake has become a prevailing practice in the insurance and reinsurance industry. The event generation model is the key component of the CAT modeling. In this paper, a physics-based tropical cyclone (TC) full track model is introduced to model typhoons events in the western North Pacific basin. At the same time, a comprehensive test of the model is presented from the perspective of CAT risk modeling for insurance and reinsurance applications. The full track model includes the genesis, track, intensity, and landing models. Driven by the global environmental circulations, the model employs the advection and beta drift theory in atmospheric dynamics to model the track of typhoons. The proposed model is novel in the way of modeling the genesis of TCs with three-dimension kernel distributions in space and time. This enables the simulation of seasonal characteristics of TCs. By generating 10,000-year TC events, we comprehensively test the model from the standpoint of CAT insurance and reinsurance applications. The typhoon hazard model and the generated events can serve as the inputs for assessing the typhoon risk and insured loss caused by winds, rains, floods, and storm surges.
Keywords
INTRODUCTION
The western North Pacific (WNP) basin is one of the regions with the most frequent and strongest tropical cyclones (TCs) in the world[1]. Generally, the total number of intense TCs exceeds 20 per year and yet reaches 40 in some years. China has suffered an average annual loss of about 25 billion yuan caused by typhoons from 1983 to 2008 with an average of 8 typhoons making landfall per year[2]. It appears that the typhoon loss increase, worldwide, is due to the warming climate. Insurance and reinsurance provide the necessary financial mechanism to mitigate the impact of natural disasters such as typhoons. At the same time, it enhances the resilience of society.
Catastrophe (CAT) is generally defined as a category of natural and manmade disasters with low frequency but huge impact and great uncertainty of consequence, e.g., financial loss and death toll. CATs include both natural disasters such as typhoons, earthquakes, floods, wildfires, and manmade disasters such as terrorist attacks, cyber-attacks, and pandemics. Due to their low frequency and high uncertainty of loss, the risk assessment of CATs is not reliable by the reported historical losses or observations, especially for predicting the loss of events at the long tail of distributions. The use of special computer models based on physical mechanisms and statistics is becoming more prevailing in the insurance and reinsurance industry. Simultaneously, a substantial demand for risk premium pricing, portfolio, and cash flow management is apparent in these two domains.
These computer models, which are called CAT models, are composed of three elements: hazard module, engineering module, and financial module. The hazard module simulates the magnitude, frequency, location, and characterization of the hazard events. On the other hand, the engineering module defines the exposure in terms of range, type and value of the affected objects, and the extent of damage to the objects caused by the hazard. The financial module yields the financial loss or financial implication to the insurers. In this paper, we focus our scope on the hazard module.
The existing typhoon hazard models are mainly based on historical typhoon data. Although researchers began to track and observe the interior of typhoons and hurricanes using reconnaissance aircraft and dropsondes since the 1940s, some TCs were still absent until the application of meteorological satellites in the 1970s[3]. Limited by the accuracy and performance of the early observational instruments, the quality of observational data, in the early years, was worse than that of the meteorological satellite era in post 1970s, especially for the intensity observations. Basically, direct use of a limited amount of historical observation data may not be sufficient to obtain a reliable estimate of typhoon hazards. The current studies extract typhoon characteristics from historical data to simulate a large number of typhoon events to expand its statistical samples. Finally, it completes the regional risk analysis through the extended typhoon samples. In the insurance industry, there are two dominant typhoon stochastic event models: the circular subregion model and the full track model.
The circular subregion model was first proposed by Russell[4] in the 1970s and subsequently improved by Tryggvason et al.[5], Batts et al.[6], Georgiou[7], Vickery and Twisdale[8]. The principal idea of the model is to center on the target point. Then, to expand it outward into a circular region with a radius of 200 to 300 km. Following this, to extract the probability distribution of the movement and intensity parameters from historical TCs passing through the circular region. Finally, the regional typhoon events are randomly simulated according to the probability distributions. The combination of the simulated typhoon events with the wind field model can estimate the wind hazard probability in the target region. This method is suitable for small area with multiple coastal cities or distributed infrastructure such as railways, highways, and power grid systems. However, for areas with insufficient historical typhoon data, it may not be possible to obtain sufficient typhoon samples, in the target region, to establish a reliable typhoon hazard model.
To overcome the above shortcomings, Vickery et al.[9] developed an empirical full track model using historical samples of TCs in the Atlantic Ocean. Compared to the circular subregion model, the full track model can synthesize the track and intensity of the typhoon from generation to extinction. This facilitates typhoon risk assessment for a large range of areas. Later, Vickery et al.[10] applied it to the hurricane hazard assessment in coastal areas of the United States. Although the full track model was continually improved by many works[11-20], its core ideas are still consistent. The full track model simulates the initial genesis position of typhoons. Then, the migration speeds and directions are simulated. Following this, the model predicts the intensity of wind at each location affected by the typhoon.
Specifically, for genesis position simulation, Vickery et al.[9] randomly sampled genesis positions directly from the historical data, yielding a restricted distribution of the simulated initial positions. James and Mason[11] randomly interpolated the historical genesis positions to synthesize a large number of genesis positions. Alternatively, Rumpf et al.[12,13], Emanuel et al.[14], and Hall and Jewson[15] used the Gaussian kernel density function to estimate the generation probability of each location in the ocean. Thus, the simulated genesis position is extended to a larger area covering the entire sea. For movement simulation, one method is to estimate the typhoon velocity through the historical movement speed and direction[11-13]. The other method is to establish the relationship between movement of typhoons, ambient airflow, and β-drift term[14,20]. This method is more suitable for areas with insufficient historical typhoon data because the ambient airflow can be easily obtained from reanalysis data. Similarly, there are two approaches for intensity simulation: statistical method and physical method. The former is a statistical intensity model based on historical typhoon intensity samples, such as autoregressive[9,10,18], and Markov[14] models. The latter, physical method, is a numerical intensity model based on simplified cyclone physics[3,14]. Although it is based on atmospheric physics, it requires more computational time.
In general, the full track model can simulate the track and intensity of typhoons from generation to extinction. Therefore, the typhoon hazard assessment can be performed on a large area to quantify the relevance of typhoon activities in different countries or regions. This is critical for insurers and reinsurers with a global presence. One of the main motivations of this paper is to develop a typhoon hazard model for CAT modeling which can be applied and leveraged by the insurance and reinsurance industry. In this paper, we introduce a novel statistical dynamic model which simulates genesis, track, and intensity of typhoons. Compared to the recent model developed by Chen and Duan[20], our typhoon model improves modeling data, simulation of genesis, track, and intensity. We use our proposed model to generate an event set of 10,000-year typhoon. Then, to demonstrate the competence of our model, we test it on the generated event set comprehensively, from the perspective of catastrophe insurance, including the intensity and frequency of typhoon landings, noting that the insurance industry is mostly interested in these aspects. In this paper, typhoon and TC are used interchangeably and they are the same except for the specified.
MODELING DATA
The commonly used best track data sets of the WNP basin are from the Shanghai Typhoon Institute of China Meteorological Administration (CMA)[21], the Japan Meteorological Agency (JMA), and the United States Joint Typhoon Warning Center (JTWC), respectively. Due to the different methods and criteria for discriminating typhoon events, the best track data sets of the three organizations differ in several ways. As shown in Figure 1, prior to the 1990s, the annual TCs recorded by the CMA occurs much more frequently than those of the JMA and JTWC. Especially prior to the 1980s, the number of TCs recorded by CMA is much higher than the others. Notably, the JMA best track data only counts tropical storms with intensity greater than 35 knots (about 18 m/s, 10-min average wind speed). To fairly compare the three data sets, we count the annual number of TCs with the maximum intensity above the tropical storm level (17.2 m/s). As shown in Figure 2, the annual number of TCs in the three data sets post 1980 is relatively close, especially for the CMA and JMA data sets. The difference in the annual TC number of the three data sets is mainly manifested in the number of tropical depression records. The insurance and reinsurance industry pay more attention to the landing typhoons. For the typhoons landing in China, the CMA record is believed to be more reliable than the JMA and JTWC records, the latter is employed in the Chen and Duan model[20]. Therefore, the CMA data sets are utilized in this study.
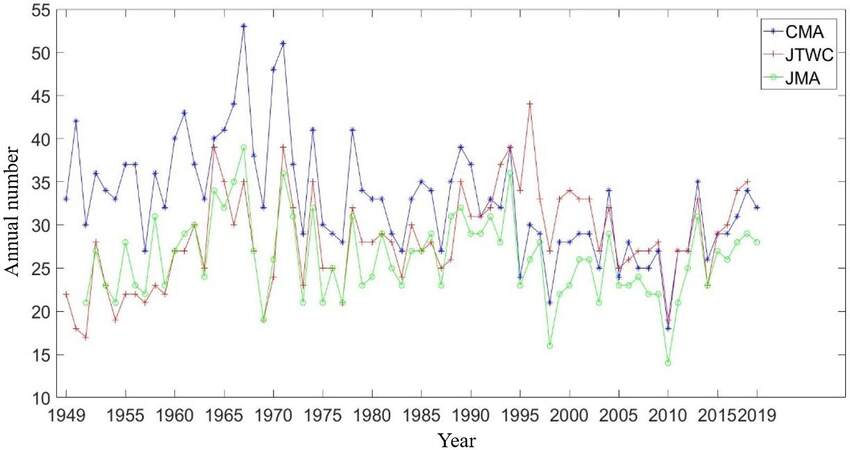
Figure 1. The annual number of tropical cyclones recorded by the CMA, JTWC, and JMA from 1949 to 2019. CMA: China Meteorological Administration; JTWC: the United States Joint Typhoon Warning Center; JMA: Japan Meteorological Agency.
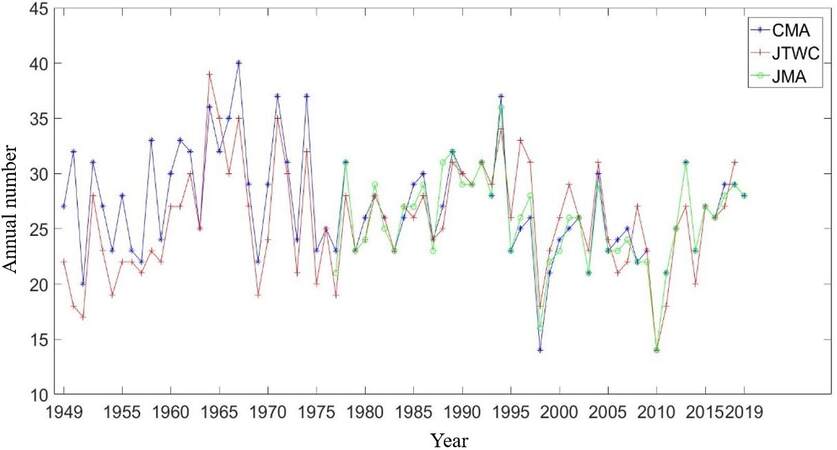
Figure 2. The annual number of tropical cyclones with the maximum intensity above the tropical storm level (17.2 m/s) recorded by the CMA, JTWC, and JMA. JMA record did not report maximum wind speed before 1977. CMA: China Meteorological Administration; JTWC: the United States Joint Typhoon Warning Center; JMA: Japan Meteorological Agency.
The CMA best track data reports the center position and intensity of typhoons that occurred in the NWP basin from 1949 to 2019. They are provided for every 6 h. The period from 1980 to 2019 is used to develop the typhoon hazard model because the data quality post the 1980s is more reliable than prior to it. It is worth noting that the maximum wind speed in the data set is a 2-min average value at a height of 10 meters. The detailed description of the data set is illustrated in Table 1.
The typhoon best track data of CMA
| Parameter name | Time range | Time accuracy | Remarks |
| Center position | 1980-2019 | Every 6 h | - |
| Maximum wind speed | 1980-2019 | Every 6 h | 2-min average, 10 m height |
| Center pressure | 1980-2019 | Every 6 h | - |
The environmental parameter data is obtained from the National Centers for Environmental Prediction (NCEP)/the National Center for Atmospheric Research (NCAR) global reanalysis data[22] and the COBE-SST data[23,24]. It includes 6 h atmospheric environmental wind velocity, monthly average atmospheric environmental temperature, monthly average atmospheric specific humidity, and monthly average sea surface temperature (SST) as described in Table 2. The atmospheric environment wind speed and temperature of the NCEP/NCAR global reanalysis data in height is from 1000 hPa to 10 hPa, a total of 17 pressure layers, and that of the specific humidity is at the bottom 8 pressures layers. Since the location of the typhoon center does not necessarily fall on the grid of the reanalysis data, the environmental parameters are linearly interpolated, in the simulation, to the location and time of the typhoon center.
The environmental reanalysis data
| Parameter name | Source | Time range | Time accuracy | Spatial resolution |
| Environmental wind velocity | NCEP/NCAR | 1980-2019 | Every 6 h | 2.5° × 2.5°, 17 levels |
| Atmospheric temperature | NCEP/NCAR | 1980-2019 | Monthly | 2.5° × 2.5°, 17 levels |
| Specific humidity | NCEP/NCAR | 1980-2019 | Monthly | 2.5° × 2.5°, 8 levels |
| Sea surface temperature | COBE-SST | 1980-2019 | Monthly | 1° × 1° |
FULL TRACK MODEL BASED ON STATISTICS AND DYNAMICS OF TC
Genesis simulation
The full track typhoon hazard model is composed of three parts: genesis model, movement model, and intensity model. The genesis model simulates the number, location, and time of TCs generation. It has been found that the historical annual TC occurrence follows Poisson distribution by the K-S test at a 5% significance level. Unlike the kernel density method used in Chen and Duan model, we use this hypothesis distribution to model the annual occurrence of TCs in the WNP basin, as shown in Equation (1).

where k is the annual occurrence number; λ is the annual average occurrence number, which is estimated from the typhoon best track data set. The annual occurrence number can be randomly sampled by the Monte Carlo method using the distribution in Equation (1).
Regarding the location and time of TC generation, we define the occurrence of TC when the cyclone reaches 15 m/s for the first time. The Gaussian product kernel density method is used to estimate the three-dimensional space-time probabilistic distribution of TC generation. The three dimensions are longitude, latitude, and time of TCs. The distribution is shown in Equation (2).
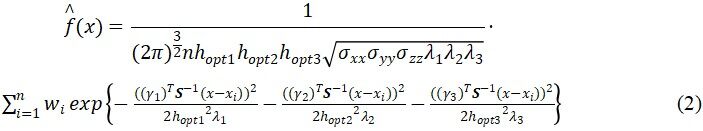
where x is the vector of genesis position; xi is the vector of genesis position sample; n is the genesis sample size; S is the standard deviation matrix of the genesis position; σxx, σyy, and σzzare the variances of the longitude, latitude, and time respectively; γ1, γ2, and γ3 are the eigen-vectors of the correlation coefficients between the three variables after standardization; wi is the weight of the generated probability; λ1, λ2, and λ3 are the eigenvalues, respectively; hotp1, hotp2, and hotp3 are the optimum bandwidths which are determined by minimizing the Equation (3)[25].
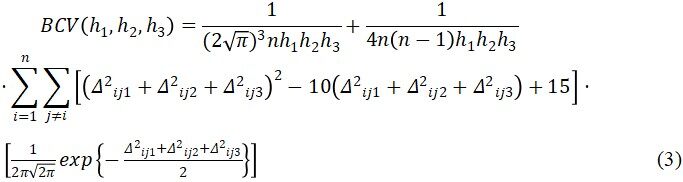
Where Δijk = (xik - xjk)/hk, xik, and xjk represent the kth dimension of the ith and jth normalized variables; hk represents the kth dimensional bandwidth, k = 1, 2, 3.
Track simulation
The typhoon track is mainly controlled by the large-scale environmental airflow and β drift. Therefore, we decompose the typhoon migration velocity into the steering velocity component caused by the atmospheric ambient flow, and the β drift component, with which the typhoon interacts with the ambient atmosphere. The steering airflow velocity is estimated using 6 h environmental wind velocity from NCEP/NCAR reanalysis data. In order to further consider the variation in migration velocity, the β drift is modeled with a regression model with random noises, instead of using a regional average value as in Chen and Duan model which will cause the simulated speed to be closer to the average value. The migration velocity is described in Equation (4).

where Ui and Vi are the latitudinal and longitudinal velocity at the current moment, respectively; the subscript i and i-1 present the current and previous 6-h moment, respectively; Usteer,i and Vsteer,i are the latitudinal and longitudinal velocity of steering flow, respectively, defined as a 250 to 850 hPa pressure-weighted mean wind speed averaged over annulus 5° latitude from the typhoon center; γu and γv are the regression coefficients of the migration velocity. The WNP basin is divided into 5° × 5° grids for estimating the regression coefficients of each grid; βx and βy are the latitudinal and longitudinal β drift, respectively; a0, a1, b0, b1are the autoregressive coefficients of the β drift; εx and εy are assumed to be normal random terms. To eliminate the interference of the cyclone vortices on the calculation of the steering flow in the historical reanalysis typhoon wind field data, this study uses a filtering method proposed by
Intensity simulation
The intensity model includes two parts: ocean intensity model and land decay model. When typhoons travel over the ocean, the ocean intensity model is used. Here we use the maximum wind velocity at typhoon center at 10-m height as the typhoon intensity measure, and develop an ocean intensity model based on the autoregressive method. First, we take the 6-h change in the logarithm of relative intensity as the dependent variable. Independent variables may include climate and persistence variables, as well as atmospheric and marine environmental parameters extracted from the environmental reanalysis data, such as SST, relative humidity, wind shear, and so on. Compared with the Chen and Duan model, we consider more independent variables, such as the relative humidity and the wind shear which are not considered in the previous model. We have found that the intensity simulation results in high latitude areas will be too large without those variables. In addition, the 6-h changes of these variables are also considered to be potentially the explainable variables. The stepwise regression method and the best independent variables are selected from the candidate independent variables to ensure the significance of the regression equation. A random error term is also introduced to model the regression residuals. The ocean intensity model is finalized in the form of Equation (5). The second equation of Equation (5) is for the first step of the regression model.
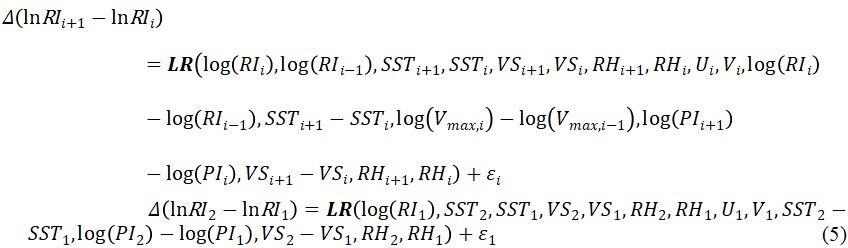
where i + 1, i - 1, and i are the next 6-h moment, the previous 6-h moment, and the current moment, respectively; LR is a linear regression operator, which divides the WNP into 5° × 5° grids for estimating regression coefficients of each grid; RI is the relative intensity, RI = (Vmax)/PI; Vmax is the maximum wind speed; PI is the potential intensity[27]; SST is the monthly SST; VS is the monthly vertical wind shear; RH is relative humidity; U is the latitudinal migration speed; V is the longitudinal migration speed; ε is the normal random term of intensity.
Once the typhoon landfalls, the heat source will be cut off, coupled with friction on the ground, thus the intensity will gradually decrease. From the landing intensity record, the variation of landing intensity presents an e-index decreasing relationship with time[28]. Here we establish a regional intensity decay model in mainland China to estimate the intensity on land, as shown in Equation (6).

where ΔP(t) is the central pressure difference at time t after the typhoon makes landfall; ΔP0 is the central pressure difference at the time of typhoon landfall; a is the decay coefficient; a0 and a1 are fitting constants; ε is the normal random residual term.
We use both the central pressure difference and the surface maximum wind speed (2-min average wind speed at 10 m height) to qualify the intensity of TCs. The former is used for TCs after landfall, and the latter for TCs over the sea. Equation (7) which relates the maximum wind speed to the central pressure difference is fitted for ocean and land, of which the R-squared value are 0.97 and 0.91, respectively.

Where Δpocean and Δpland is central pressure difference on ocean and land, respectively.
Different from the k-nearest neighbor method used in Chen and Duan model to estimate the landing intensity, we group the areas with similar landing terrains together for estimating the decay coefficient. As the decay of typhoon after landing may differ from region to region because of the topography, we divide the coastline of mainland China and Hainan Island (excluding Taiwan island) into the following 6 regions, as shown in Table 3. We respectively fit Equation (6) in the six regions. We find that only the area 1 (Hainan and Leizhou Peninsula) has samples with the decay coefficient a < 0. This is because typhoons passing this area may re-enter sea and make landfall twice. For typhoons that do not enter the sea after landing,
Division of typhoon landfall area and the decay coefficients
| Area number | Area name | Regional boundary | Fitting decay coefficient |
| Area 1 | Hainan Island, Leizhou Peninsula | ≤ 21.50°N | a0 = 0.0108 a1 = 0.0003 σ = 0.0117 a ≥ -0.04 |
| Area 2 | Guangxi, Guangdong (excluding Leizhou Peninsula) | (21.50°N, 23.50°N] | a0 = 0.0244 a1 = 0.0005 σ = 0.008 a > 0 |
| Area 3 | Fujian | (23.50°N, 27.00°N] | a0 = 0.0000 a1 = 0.0010 σ = 0.0074 a > 0 |
| Area 4 | Zhejiang (south of Zhoushan) | (27.00°N, 30.00°N] | a0 = 0.0163 a1 = 0.0004 σ = 0.0063 a > 0 |
| Area 5 | Shanghai and Jiangsu (north of Zhoushan) | (30.00°N, 35.00°N] | a0 = 0.0000 a1 = 0.0010 σ = 0.0057 a > 0 |
| Area 6 | Bohai Bay (Shandong, Tianjin, Hebei, Liaoning) | >35.00°N | a = 0.0196 σ = 0.0117 |
TESTS AND RESULTS
We use the developed full track model to generate a 10,000-year typhoon event set, which has about 300,000 simulated typhoon events with the position, time, and intensity of each typhoon at every 6 h. We compare the statistics of the 10,000-year typhoon event set with the CMA best track data of three different periods (1949 to 1979, 1949 to 2019, 1980to 2019). The historical data from 1980 to 2019 is what the model was built from, and the comparison with the 1980 to 2019 statistics is the in-sample test.
Statistics of TC events
Figure 3 compares the annual occurrence frequency of the simulated TCs in the WNP basin and that of the CMA best track dataset (1980 to 2019, 1949 to 1979, 1949 to 2019). The simulated annual average number of typhoons is the same as that of 1980 to 2019 which is 29.77. The annual average number of 1949 to 1979 and 1949 to 2019 are 37 and 32.9, respectively. Compared with the simulation results, the annual average numbers of 1949 to 1979 are obviously larger, which is consistent with the data shown in Figure 1. We tested the probabilistic distribution of the annual occurrence number of typhoons. The results indicate that the simulated events are consistent with the historical data from 1980 to 2019 at the 5% significance level, but are not consistent with the historical data from 1949 to 2019. In addition, we also compare the monthly occurrence frequency of the simulated TCs in the WNP basin with that of the CMA best track dataset (1949 to 1979, 1949 to 2019, 1980 to 2019). It can be seen from Figure 4 that the simulation results are consistent with the historical data of 1980 to 2019. Likewise, we used the K-S test to verify the distribution of historical data and simulations. The results show consistency between the simulated results and the historical data for the three periods.
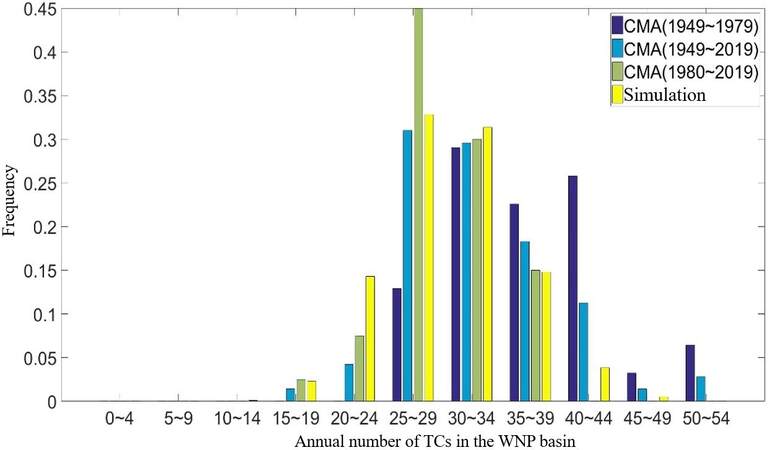
Figure 3. Frequency distribution of annual occurrence number of tropical cyclones (TCs) in the WNP basin. CMA: China Meteorological Administration; WNP: the western North Pacific.
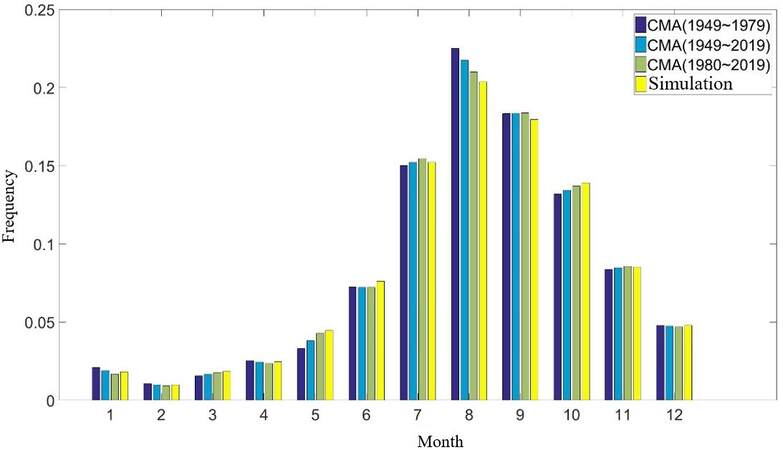
Figure 4. Frequency distribution of monthly tropical cyclones in the WNP basin. CMA: China Meteorological Administration; WNP: the western North Pacific.
We further divided the WNP basin into 2.5° × 2.5° grids and count the annual average number of typhoons passing the cells as in Figure 5. It is clear that the patterns of the three periods are unchanged from 1949 to 2019. Moreover, the correlation coefficient between the simulations and the historical data (1980 to 2019) is 0.97, indicating that the track distribution across the WNP basin is consistent between the simulation results and the historical data. However, the number of simulated TCs passing through parts of eastern Japan and north of 35°N is 13% higher than the historical records. This may be due to the interference in the steering airflow caused by the subtropical high pressure in the east of Japan which was not considered by our model.
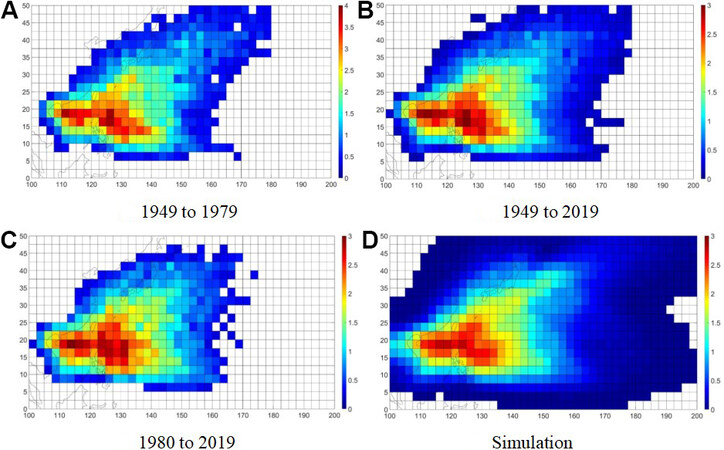
Figure 5. The annual average number of tropical cyclones passing in the 2.5° × 2.5° grids.
Figures 6 and 7 show the average value and standard deviation of migration speed at each cell. The simulation results are consistent with the three historical best track data. The average and standard deviation of moving speeds vary at different latitudes. However, the simulation results capture this difference. In the high latitudes, both the simulation results and the historical data show higher migration speeds due to the intense prevailing westerlies. In addition, as shown in Figure 7, the typhoons moving to the northeastern part of the WNP have large uncertainty in its speed. The correlation coefficient of the average value between the simulation and the historical data from 1980 to 2019 is 0.96 while, the correlation coefficient of the standard deviations is 0.94.
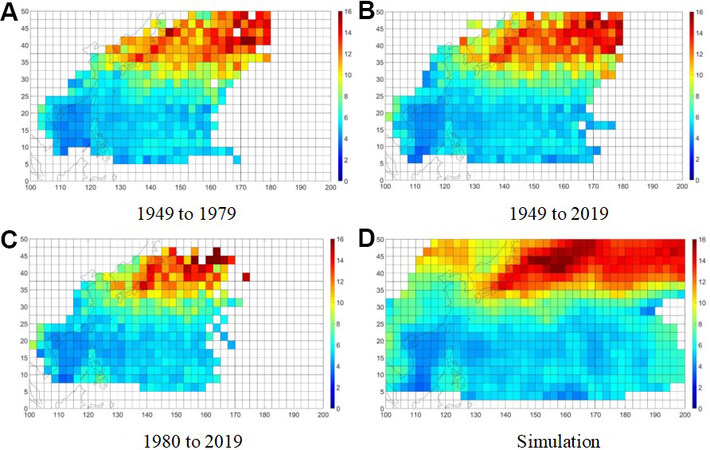
Figure 6. The average value of migration speed of tropical cyclones passing in the 2.5° × 2.5° cell (unit: m/s).
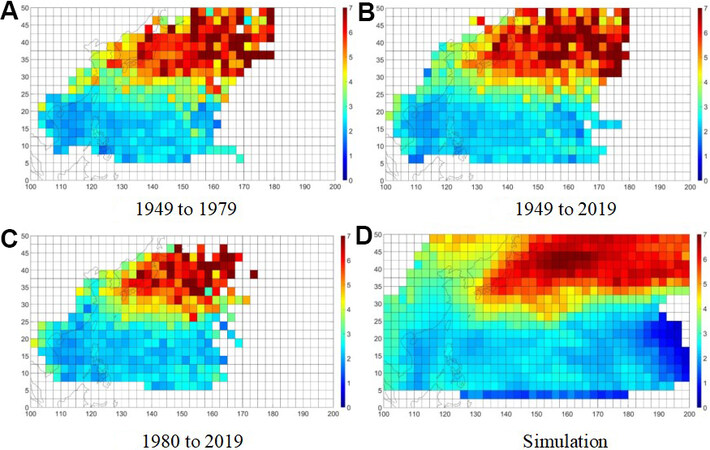
Figure 7. The standard deviation of migration speed of tropical cyclones passing in the 2.5° × 2.5°cell (unit: m/s).
Furthermore, we compared the average and standard deviation of migration direction at each cell as in Figures 8 and 9. The simulation results are consistent with the three historical best track data. The correlation coefficients of average value between the simulation and the historical data from 1980 to 2019 is 0.97 and the standard deviation is 0.74. In high latitudes, both the simulation results and historical data from the three periods show a shift in the migration direction to the northeast. At the same time, the migration direction gradually changes from west to east as the latitude increases. As shown in Figure 9, the typhoon track direction of the central part of the Pacific Ocean and the southern part of the South China Sea demonstrates larger uncertainty.
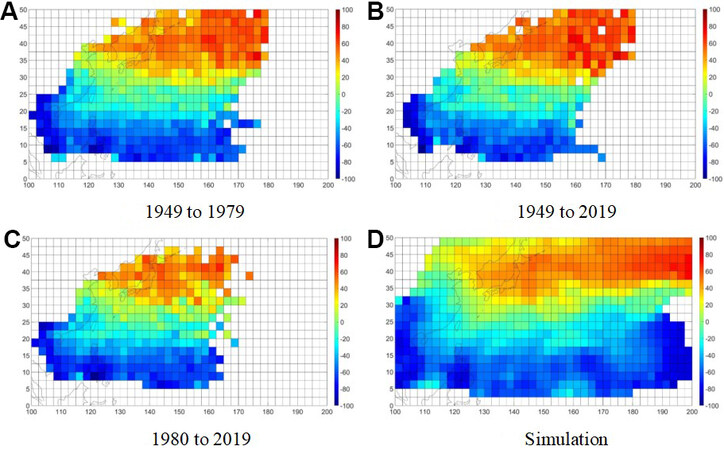
Figure 8. The average value of migration direction of tropical cyclones passing in the 2.5° × 2.5°cell (starting with the north and clockwise as positive).
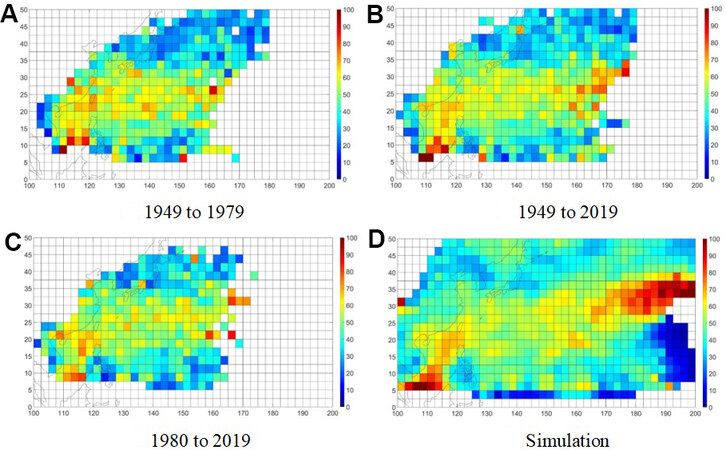
Figure 9. The standard deviation of migration direction of tropical cyclones passing in the 2.5° × 2.5° cell (starting with the north and clockwise as positive).
Finally, we compared the maximum intensity of the simulated and historical TCs in each cell (defining the intensity as the typhoon center pressure difference) as shown in Figures 10 and 11. Compared with the historical data from 1980 to 2019, the simulated average maximum intensity is consistent with that of the historical data. The maximum life intensity mainly occurs at 120°E to 152.5°E and 12.5°N to 32.5°N. The correlation coefficient of average value between the simulation and the historical data from 1980 to 2019 is 0.90 and that of standard deviation between the simulation and the historical data is 0.92. As illustrated in Figure 10, the largest difference between the simulated and historical values occurs at the southern South China Sea where fewer historical typhoons in this area were observed. From the standard deviation shown in Figure 11, the simulated maximum intensity has wider fluctuations compared with that of the historical data.
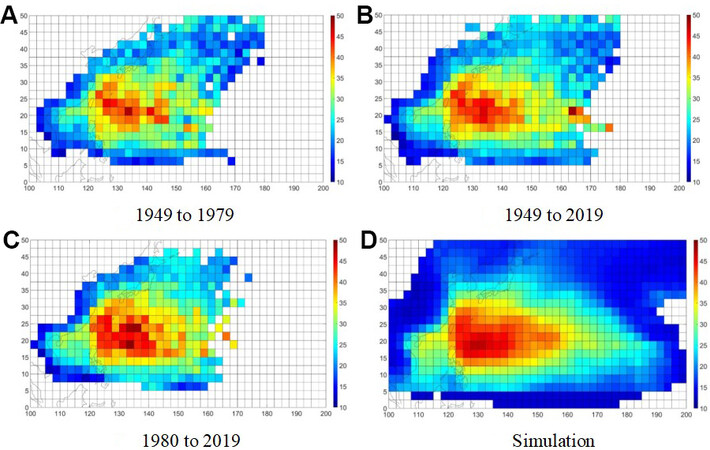
Figure 10. The average value of maximum intensity of tropical cyclones passing in the 2.5° × 2.5° cell (unit: hPa).
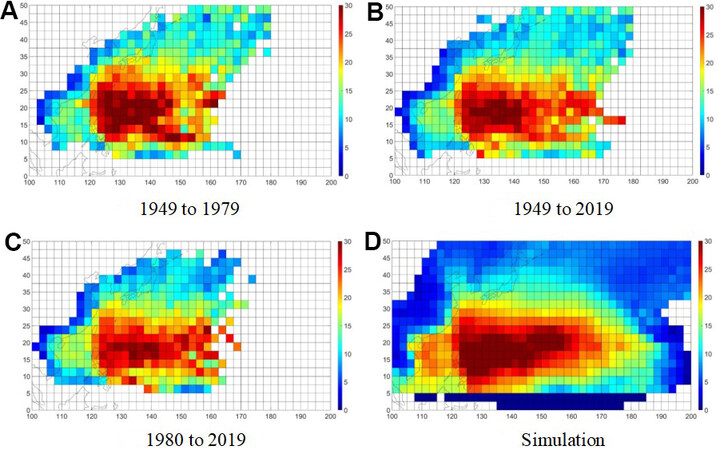
Figure 11. The standard deviation of maximum intensity of tropical cyclones passing in the 2.5° × 2.5° cell (unit: hPa).
Statistics of landing TC events
People are more concerned about the landing typhoons as most losses are due to typhoons near shore and on shore. In this section, we test the statistics of simulated typhoons against that of the best track data.
The annual average number of simulated and historical TCs landing in China are 8.25 (simulation), 8.84 (1949 to 1979), 8.39 (1949 to 2019), and 8.05 (1980 to 2019), respectively. As shown in Figure 12A, the simulation results are comparable to the historical data. Although the number of historical TCs in the CMA data set is more before the 1980s than after the 1980s, interestingly, the number of TCs landing in China is almost the same for two periods. It could be the case because many of the tropical depressions died out at sea before landing prior to the 1980s. Figure 12B shows the distribution of historical and simulated annual number of landing typhoons. The simulation has more chance to generate years with both less and more frequent landing typhoons.
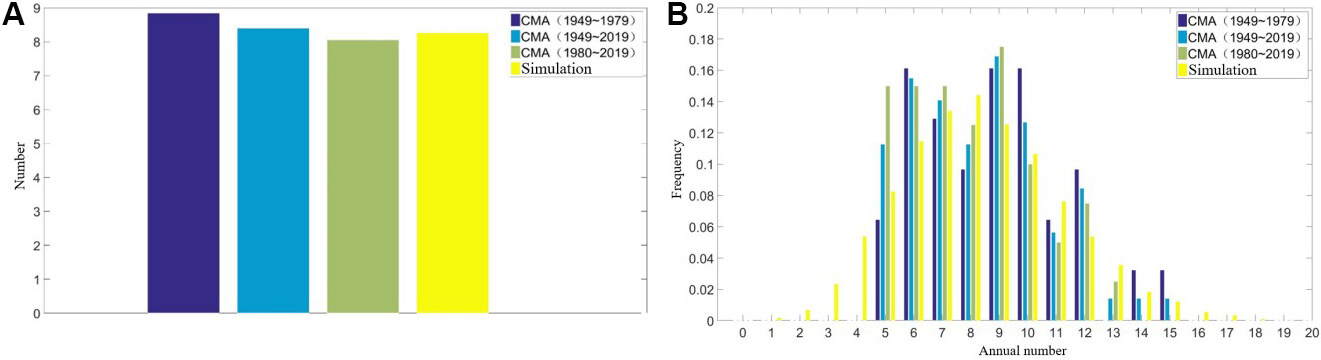
Figure 12. Annual number of tropical cyclones landing in China. (A) Annual average number; (B) annual number distribution. CMA: China Meteorological Administration.
The statistical distribution of typhoon intensity in terms of the central pressure difference after landing in China’s coastlines is shown in Figure 13A. Figure 13B shows statistical distribution of historical and simulated landfall typhoons for different typhoon intensity scales. As demonstrated earlier, the simulation results are in-line with the CMA data set (1980 to 2019) with a maximum deviation of 3.8%. Since the data samples prior to 1980 are problematic, there is a major discrepancy between the statistics of 1949 to 1979 data and 1980 to 2019 data for tropical depression and tropical storms.
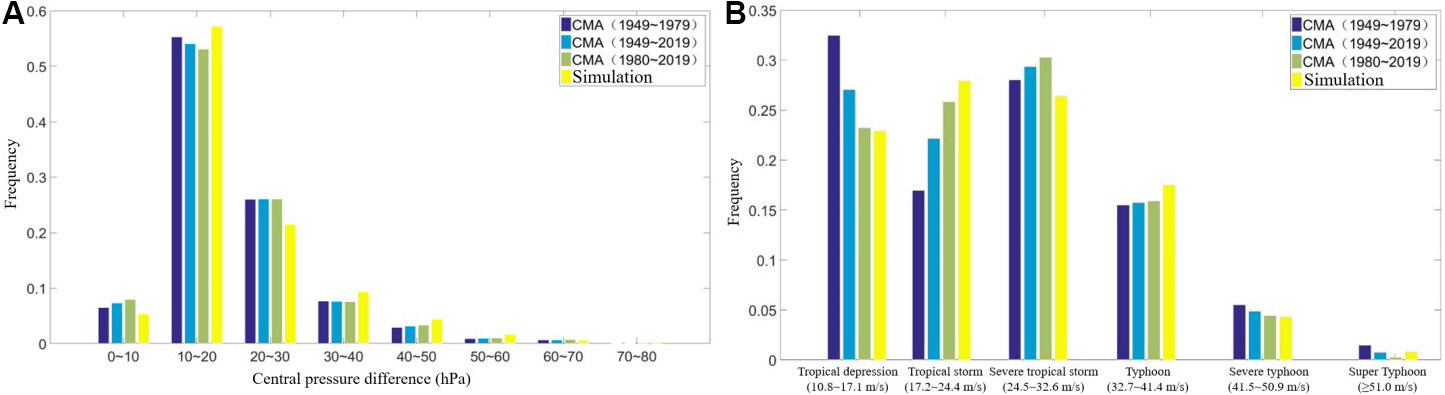
Figure 13. Intensity distribution of typhoons landing in China. (A) The central pressure difference after the typhoon landed in China; (B) landfall intensity is classified in accordance with tropical depression (10.8 to 17.1 m/s), tropical storm (17.2 to 24.4 m/s), strong tropical storm (24.5 to 32.6 m/s), typhoons (32.7 to 41.4 m/s), strong typhoon (41.5 to 50.9 m/s), and super typhoon (≥ 51.0 m/s). CMA: China Meteorological Administration.
We first segment the coastline of mainland China (which also extends to a part of Vietnam and North Korea) and Hainan Island with each segment length 100 kilometers, as shown in Figure 14. Four parameters, namely, annual landfall number, landfall migration speed, landfall direction, and landfall intensity of both the simulated and historical typhoons are calculated for each segment as shown in Figure 15. It also shows the 90% confidence interval for the four parameters. Figure 15A indicates that the model can capture both the high-frequency regions (Hainan, Guangdong, Fujian, Zhejiang, section number from 1 to 36) and low-frequency regions (Jiangsu, section number from 37 to 40). Figures 15B and C show that the track model can simulate the migration speed and direction of landing typhoons adequately. The migration speeds are slower when TC lands in high-frequency regions, which may cause more floods brought by typhoon driven-rainfall. Figure 15B and D illustrate that in areas with fewer TC landfalls (western Hainan Island and north of the Yangtze River Delta) there is a higher uncertainty of the landing parameters.
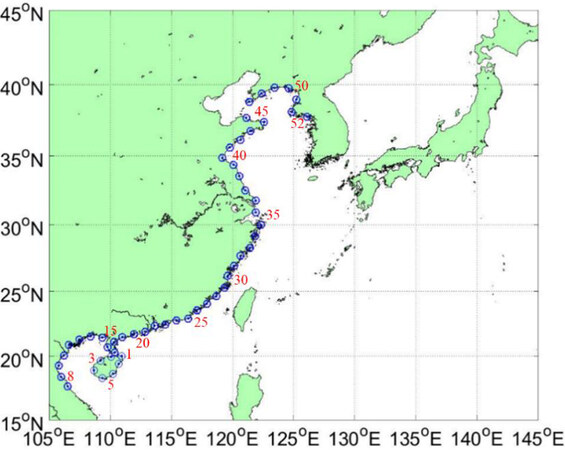
Figure 14. The coastline segments of mainland China and Hainan Island.
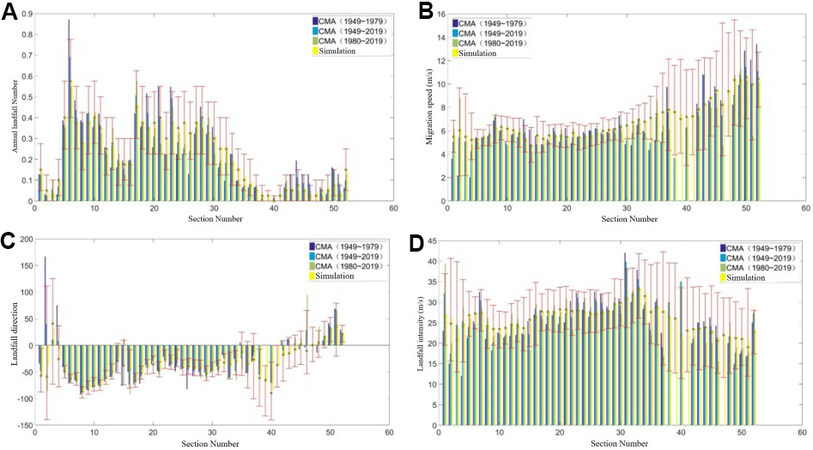
Figure 15. Landing tropical cyclones (intensity above the tropical depression, 10.8 m/s) with the segmentation of the coastlines of mainland China and Hainan Island (red bars are the 90% confidence interval of the simulation results and the green dots are the median values of the simulation results). (A) Annual average landfall number; (B) average landfall speed; (C) annual average landfall direction; (D) average landfall intensity. CMA: China Meteorological Administration.
Furthermore, we partition mainland China and Hainan Island into five regions: A, B, C, D, and E as shown in Figure 16. Area A (Hainan) and Area B (Guangdong and Guangxi) are mainly affected by TCs generated in the South China Sea followed by TCs originating in the east sea of Philippines; Area C (Fujian, Zhejiang, and Shanghai) is a mountainous region. The corresponding landing TCs decay quickly. Area C and E (Shandong, Hebei, Tianjin, and Liaoning) are mainly affected by TCs originated in the east sea of Philippines; Area D (Jiangsu) is mainly affected by TCs moving from Area C. It is less affected by direct landing TCs.
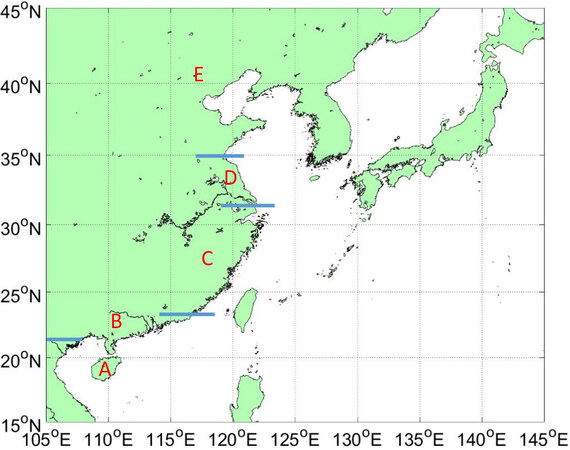
Figure 16. Partition of the coastal regions of mainland China and Hainan Island. (A) Area A; (B) Area B; (C) Area C; (D) Area D; (E) Area E.
Figure 17 shows the historical and simulated frequency distribution of annual landfall numbers of typhoons in the 5 partitions. The annual numbers of landfall typhoons in D and E are less than 3 and it is less than 6 for A. It is quite likely to have more than 6 landing TCs in B. The proportions of the central pressure difference for landfall TCs in the 5 regions are shown in Figure 18 which reveals the consistency between the simulated data and best track data.
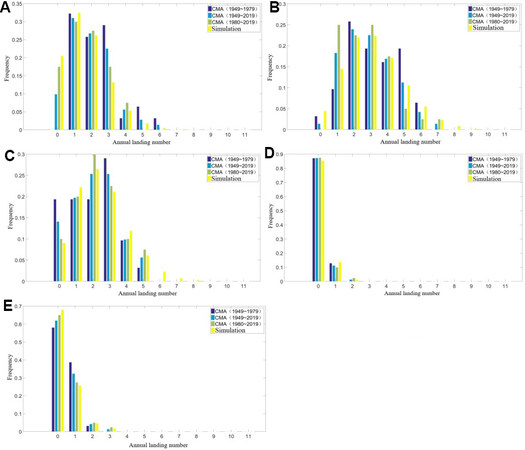
Figure 17. The frequency distribution of annual landfall numbers in 5 partitions of China coastal lines. A through E show the frequency distribution of annual landfall numbers in Areas A through E, respectively. CMA: China Meteorological Administration.
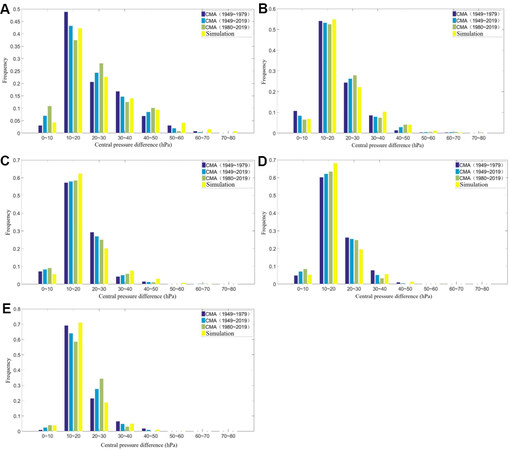
Figure 18. The frequency distribution of central pressure difference in 5 partitions of China coastal lines. A through E demonstrate the frequency distribution of central pressure difference in Areas A through E, respectively. CMA: China Meteorological Administration.
EXTREME TYPHOON EVENTS
Extreme typhoons are the most destructive and rare events which potentially cause big losses. A typhoon is considered to be extreme if it lands multiple times or if its intensity is extreme. Table 4 gives the annual average number of typhoon landings twice or more in the five partitions. It can be found that in both historical records and simulated data there is a considerable number of typhoons made multiple landfalls in the E region and a lot less in the other regions. The reason is that area E covers the area from the Shandong Peninsula to Liaoning. In parallel to this, typhoons made to the Northeast China often make their first landfall in the Shandong Peninsula and Korean Peninsula. Figure 19 presents the historical and simulated tracks in a year with the most typhoons landing in China. In best track data for 1949 to 2019, there were 15 tracks landing in China in 1952. The greatest number of simulated landfall typhoons in a year is 21.
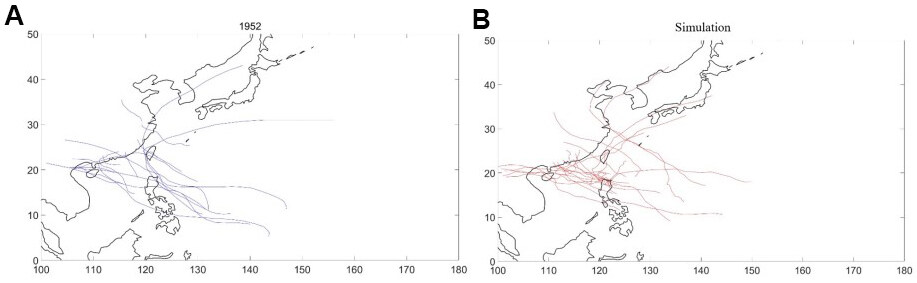
Figure 19. The tracks of the year with the most typhoons landing in China. (A) 15 typhoons landing in China in 1952; (B) 21 simulated typhoons landing in China in a year.
Annual average number of typhoons landing twice or more in each partition
| Regions | 2 landfalls | 3 landfalls | 4 landfalls |
| A | 0.0563 (0.0470) | 0.0141 (0.0044) | 0 (0.0007) |
| B | 0.0704 (0.058) | 0 (0.0016) | 0 (0.0002) |
| C | 0.0282 (0.0345) | 0.0141 (0.0015) | 0 (0.0001) |
| D | 0 (0.0048) | 0 (0.00001) | 0 (0) |
| E | 0.2817 (0.2582) | 0 (0.0104) | 0 (0.0003) |
The simulated typhoon event set of 10,000 years has about 300,000 events and the CMA best track data set of 71 years (1949 to 2019) has only about 2300 TC events. This implies that the simulation data may have much more super typhoons than those in the historical records. Table 5 shows the maximum wind speeds of landfall TCs in the historical records and the simulated data set for the five partitions. Clearly, the maximum wind speeds of the simulated landfall TCs are higher than those of the historical typhoons.
The maximum wind speeds of typhoons (m/s)
| Region | CMA (1949~2019) | Simulation |
| A | 50 | 79 |
| B | 48 | 63 |
| C | 52 | 60 |
| D | 35 | 43 |
| E | 30 | 48 |
CONCLUSIONS
Typhoon hazard module is the key component of the CAT risk modeling system. The function of the hazard module is to generate historically compatible TC events using empirical or physics-based TC hazard models. In this paper, a full track synthesis TC model based on statistics and atmospheric dynamics was introduced. It can simulate a TC from its generation in the ocean, moving track over the ocean, to its landfall and decay in the continent. The generation of TCs in the sea is modeled by the Poisson process. The statistical genesis model employs a three-dimensional kernel density function to estimate the formation of TCs in time and space. For the track modeling, a regression model of the typhoon migration speed, the steering airflow, and β drifting airflow was proposed based on the atmospheric dynamical theory. The intensity model of TC over the sea was established by the autoregressive model, in which the vertical wind shear and relative humidity were considered. After typhoons make landfall, decay models were fitted for the China mainland and offshore islands which were partitioned into six regions taking into account the geography and topography characteristics of China coastal areas. The models’ parameters were calibrated for the NWP basin using the CMA best track dataset (1979 to 2019) and NCEP/NCAR reanalysis data.
The typhoon hazard model was thoroughly and rigorously tested by generating a 10,000-year event set. Then, various comparisons were made using the statistics of the generated event set and CMA historical best track data set. From the perspective of CAT modeling in the insurance and reinsurance industry, characteristics pertaining to the generation and tracks of TCs over the sea, landfall and decay of TCs onshore on China coastal lines, and extreme TC events were studied, too. For TCs in the sea, results showed that the generated event was consistent with the historical best track data in annual average number of TC generations, track spatial distribution in the sea, migration speed and direction, and maximum intensity of TCs in the sea. The maximum life intensity of both simulated and historical typhoons mainly occurred in the sea areas within 120°E to 152.5°E and 12.5°N to 32.5°N.
For landing and decay characteristics of typhoons in China coastal lines, the annual average number of landing typhoons of the generated events matched that of the historical. The difference of the maximum intensity at landing is less than 5% between the two event sets. A close look of the landfall statistics by segmenting the China coastal lines into 100 kilometers distance mileposts showed that, the number of landfalls, the moving speed and direction, the intensity of the historical TCs fall into the 90% confidence intervals by the generated TCs. For the five partitions of China’s coastal regions, the landing typhoons showed similar characteristics between the two event sets. Rare and extreme events with multiple landfalls and very high intensity were also observed, the greater maximum intensity of simulated landfalls was reasonable with respect to its much larger data size than the historical data.
DECLARATIONS
Authors’ contributionsConceptualization, methodology, software, writing - original draft & review: Chen Y
Conceptualization, methodology, supervision, funding acquisition, & review: Duan Z, Yin J
Data Curation, investigation: Fang P, Yang J, Liu C, Zhang A, Wu T, Gong T
Conceptualization: Ou J
Availability of data and materialsNot applicable.
Financial support and sponsorshipFinancial supports from the National Key R&D Program of China (Grant #2021YFC3100702) and the National Natural Science Foundation of China (Grant #51978223) are gratefully acknowledged.
Conflicts of interestAll authors declared that there are no conflicts of interest.
Ethical approval and consent to participateNot applicable.
Consent for publicationNot applicable.
Copyright© The Author(s) 2022.
REFERENCES
1. Colbert AJ, Soden BJ, Kirtman BP. The impact of natural and anthropogenic climate change on Western north pacific tropical cyclone tracks*. J Clim 2015;28:1806-23.
2. Fengjin X, Ziniu X. Characteristics of tropical cyclones in China and their impacts analysis. Nat Hazards 2010;54:827-37.
3. Emanuel K, Sundararajan R, Williams J. Hurricanes and global warming: results from downscaling IPCC AR4 simulations. Bull Amer Meteor Soc 2008;89:347-68.
4. Russell LR. Probability distributions for hurricane effects. J Wtrwy , Harb and Coast Engrg Div 1971;97:139-54.
5. Tryggvason BV, Davenport AG, Surry D. Predicting wind-induced response in hurricane zones. Journal of the Structural Division 1976;102:2333-50.
6. Batts ME, Simiu E, Russell LR. Hurricane wind speeds in the United States. J Struct Div 1980;106:2001-16.
7. Georgiou PN. . Designing wind speeds in cyclone-prone regions. London, Ontario, Canada, BLWT2: University of Western Ontario; 1985. p. 161-211.
8. Vickery PJ, Twisdale LA. Prediction of hurricane wind speeds in the United States. J Struct Eng 1995;121:1691-9.
9. Vickery PJ, Skerlj PF, Twisdale LA. Simulation of hurricane risk in the US using empirical track model. J Struct Eng 2000;126:1222-37.
10. Vickery PJ, Wadhera D, Twisdale LA, Lavelle FM. U.S. Hurricane wind speed risk and uncertainty. J Struct Eng 2009;135:301-20.
11. James MK, Mason LB. Synthetic tropical cyclone database. J Waterway, Port, Coastal, Ocean Eng 2005;131:181-92.
12. Rumpf J, Weindl H, Höppe P, Rauch E, Schmidt V. Stochastic modelling of tropical cyclone tracks. Math Meth Oper Res 2007;66:475-90.
13. Rumpf J, Weindl H, Höppe P, Rauch E, Schmidt V. Tropical cyclone hazard assessment using model-based track simulation. Nat Hazards 2009;48:383-98.
14. Emanuel K, Ravela S, Vivant E, Risi C. A statistical deterministic approach to hurricane risk assessment. Bull Amer Meteor Soc 2006;87:299-314.
15. Hall TM, Jewson S. Statistical modelling of North Atlantic tropical cyclone tracks. Tellus A 2007;59:486-98.
16. Yonekura E, Hall TM. A statistical model of tropical cyclone tracks in the Western north pacific with ENSO-dependent cyclogenesis. J Appl Meteorol Climatol 2011;50:1725-39.
17. Yasuda T, Mase H, Co LK, et al. Stochastic typhoon model and its application to future typhoon projection. Int Conf Coastal Eng 2011;1:16.
18. Li SH, Hong HP. Typhoon wind hazard estimation for China using an empirical track model. Nat Hazards 2016;82:1009-29.
19. Nakajo S, Mori N, Yasuda T, Mase H. Global stochastic tropical cyclone model based on principal component analysis and cluster analysis. J Appl Meteorol Climatol 2014;53:1547-77.
20. Chen Y, Duan Z. A statistical dynamics track model of tropical cyclones for assessing typhoon wind hazard in the coast of southeast China. Journal of Wind Engineering and Industrial Aerodynamics 2018;172:325-40.
21. Ying M, Zhang W, Yu H, et al. An overview of the China meteorological administration tropical cyclone database. J Atmos Ocean Technol 2014;31:287-301.
22. Kalnay E, Kanamitsu M, Kistler R, et al. The NCEP/NCAR 40-year reanalysis project. Bull Amer Meteor Soc 1996;77:437-71.
23. Folland CK, Parker DE. Correction of instrumental biases in historical sea surface temperature data. Q J Royal Met Soc 1995;121:319-67.
24. Ishii M, Shouji A, Sugimoto S, Matsumoto T. Objective analyses of sea-surface temperature and marine meteorological variables for the 20th century using ICOADS and the Kobe Collection. Int J Climatol 2005;25:865-79.
25. Sain SR, Baggerly KA, Scott DW. Cross-validation of multivariate densities. J Am Stat Assoc 2012;89:807-17.
26. Kurihara Y, Bender MA, Tuleya RE, et al. Improvements in the GFDL hurricane prediction system. Mon Weather Rev 1995;123:2791-801.
27. Bister M, Emanuel KA. Low frequency variability of tropical cyclone potential intensity 1. Interannual to interdecadal variability. J Geophys Res 2002;107:ACL 26-1.
Cite This Article
Export citation file: BibTeX | RIS
OAE Style
Chen Y, Fang P, Yang J, Liu C, Zhang A, Wu T, Gong T, Yin J, Duan Z, Ou J. A statistics and physics-based tropical cyclone full track model for catastrophe risk modeling. Dis Prev Res 2022;1:3. http://dx.doi.org/10.20517/dpr.2021.08
AMA Style
Chen Y, Fang P, Yang J, Liu C, Zhang A, Wu T, Gong T, Yin J, Duan Z, Ou J. A statistics and physics-based tropical cyclone full track model for catastrophe risk modeling. Disaster Prevention and Resilience. 2022; 1(1): 3. http://dx.doi.org/10.20517/dpr.2021.08
Chicago/Turabian Style
Chen, Yu, Pingzhi Fang, Jian Yang, Chen Liu, Anyu Zhang, Tiantian Wu, Ting Gong, Jianming Yin, Zhongdong Duan, Jinping Ou. 2022. "A statistics and physics-based tropical cyclone full track model for catastrophe risk modeling" Disaster Prevention and Resilience. 1, no.1: 3. http://dx.doi.org/10.20517/dpr.2021.08
ACS Style
Chen, Y.; Fang P.; Yang J.; Liu C.; Zhang A.; Wu T.; Gong T.; Yin J.; Duan Z.; Ou J. A statistics and physics-based tropical cyclone full track model for catastrophe risk modeling. Dis. Prev. Res. 2022, 1, 3. http://dx.doi.org/10.20517/dpr.2021.08
About This Article
Copyright

Data & Comments
Data


 Cite This Article 38 clicks

 Like This Article 14
likes
Like This Article 14
likes


Comments
Comments must be written in English. Spam, offensive content, impersonation, and private information will not be permitted. If any comment is reported and identified as inappropriate content by OAE staff, the comment will be removed without notice. If you have any queries or need any help, please contact us at support@oaepublish.com.