
Modelling of multi-sectoral critical infrastructure interdependencies for vulnerability analysis

 ,
, Abstract
Critical infrastructure such as the transportation, power generation, water supply, telecommunications, security and health services/systems, etc. are essential for providing a reliable flow of goods and services, crucial to the functioning of the economy and society. These infrastructures are closely linked and dependent on one another, and these interdependencies need to be modelled in order to analyse the disruptions and vulnerabilities of critical infrastructure networks as a whole. With increased, investment and complexity in the coupling of gas and electricity network, limitations and vulnerabilities of the coupled networks are becoming increasingly relevant to the operational planning of the critical infrastructures. Current modelling of a coupled gas and electricity network will be used in conjunction with nation input-output interdependency model to model physical critical infrastructures and critical infrastructure interdependencies, respectively. This research work will tackle two possible scenarios that might happen in the gas network while evaluating the cascading impact both in the physical model perspective and input-output interdependency model perspective. The results will provide insights on how disruption in the gas network affects the electricity grid and its corresponding economic impact on all economic sectors in a nation.
Keywords
Introduction
In spite of the progress in global/national development and advancements in technology, the world has seen an alarming increase in human and economic losses due to catastrophic events, either natural or man-made. The higher levels and complexities of human and economic activities, the massive urbanization especially with the emergence of megacities in Asia, as well as the relationships among nations in the globalized world, may have also changed the character of these disasters, giving rise to some unique and non-traditional risk management issues. In these events, the disruption or physical damage on critical infrastructure can have a crippling effect with cascading failures within the infrastructural network, resulting in severe impact on human health, safety, the economy, and even loss of life. Critical infrastructure such as the transportation, power generation, water supply, telecommunications, security and health services/systems, etc. are essential for providing a reliable flow of goods and services crucial to the functioning of the economy and society. These infrastructures are closely linked and dependent on one another, and these interdependencies need to be modelled in order to analyse the disruptions and vulnerabilities of critical infrastructure networks as a whole.
With the increasing investment and complexity in the coupling of gas and electricity network, limitations and vulnerabilities of the coupled networks are becoming increasingly relevant to the operational planning of the critical infrastructures. This is especially problematic when the multiple critical infrastructures of different characteristic and scale are considered, and their failure propagation and disruption analysis critical for the stakeholder[1,2]. Thus, it is essential to model and analyse the impact of the interdependency between the gas and electricity infrastructure networks. The specific aim/scope of this research plan is to model realistic multi-sectoral physical infrastructures such as gas and electricity physical infrastructure networks with open-source data, simulating the cascading failure of the two infrastructure networks and the evaluation of cascading economic failure/disruption impact using critical infrastructure interdependency model.
For this research, Singapore will be used as a case study example. As of 2017, Singapore has a population of around 5.7 million with a population density of 8188 people per square kilometre. Singapore is considered a mega city by Bronger[3] definition and is ranked 3rd in terms of population density in the world by CIA World Factbook[4]. With this kind of population density, a small disruption to the critical infrastructures that only affects a small area in the country may have enormous effect on the population. In particular, the energy industry is one of the most important sectors in Singapore. Not only does a country use natural gas to produce electricity in power plants, but natural gas is also being used by other industries for other uses, and household uses. Any disruption to Singapore in the natural gas network will have tremendous impact to Singapore. Singapore has to find ways to protect and mitigate its energy security to avoid incidents like the power failure on 29 June 2004[5] that caused 300,000 houses to plunge into darkness, 60% of Singapore road traffic lights had become non-operational and an estimated cost of losses to business amounted to a total of SGD$6 million[6]. The 29 June 2004 power failure in Singapore was due to a series of failures ranging from equipment non-performance at ConocoPhillips’ onshore receiving facility (ORF) to non-performance of hot-switching (i.e., timely change of the fuel from natural gas to oil products for its turbines) on the Combined Cycle Gas Turbines (CCGTs) in the power plants. Hot-switching is one of the example of contingency planning if gas is not able to be supplied to CCGTs in power plant, which failed to work when there is a need to. No matter the reason behind it, critical infrastructure stakeholders will need to be aware of events that might happen; even if safety features are already in place, effective emergency response action plans are needed to respond to the worst-case scenarios. In response to the 2004 incident, liquefied natural gas (LNG) has since been proposed by the investigation committee to diversify the fuel mix in Singapore. Another massive power outage happened in Singapore on 18 September 2018[7] at around 1.18 am in midnight and had affected 147,000 households, 2 hospitals and traffic lights along the road as the blackout happened all across Singapore in 19 different areas. Electricity was restored at 1.56 am, because of the timing of this event, there was not too much inconvenience to the public due to swift restoration. The preliminary investigation points to loss of power supply from two power generation units in the power plant, starting from a failure on one of the power-generating unit at Sembcorp Cogen Pte Ltd. and then the tripping of another power-generation unit at Senoko Energy Pte Ltd. while it was ramping up power generation to meet the uninterrupted power grid demand. Power was progressively restored in 38 min with the help of other standby power generating units. These two incidents show the vulnerability of the complex electricity system in modern city.
Presently, all natural gas in Singapore is being imported, either from the neighbouring countries like Malaysia and Indonesia or through LNG via shipment from 4 main gas ORF. Around 95 per cent of Singapore’s electricity[8] is generated using natural gas, which makes the gas sector in Singapore very important as electricity is the core of the modern society.
In general, modelling of the gas and electricity networks is done independently while some researchers have attempted to combine both gas and electricity networks together. For the design and analysis of gas networks, the operating parameters (e.g., diameter, thickness, pressure, length, internal roughness, flow rate of the pipeline) are usually taken into account. Different researchers analysed the gas flow problem as an optimization problem that handles two conflicting objectives of power consumption and gas flow rate, based on three different network topologies[9]; two objectives that investigate the initial investment cost and the operating gas transmission cost[10,11], or a multi-objective problem that attempts to minimize fuel consumption in compressors and maximizing gas flow throughput[12]. Ruan et al.[13] attempted the gas pipeline problem from the perspectives of optimization of initial investment and simulation of the operating condition pipeline to show the model suitability to a practical scenario. Ríos-Mercado et al.[14] proposed a heuristic solution to optimize the gas transmission system through a cyclic gas network topology. Kabirian and Hemmati[15] also attempted to model gas network based on a nonlinear optimization model to design an optimal gas network structure based on long-term operating and capital cost. Woldeyohannes and Majid[16] developed a simulation model for natural gas transmission pipeline system that involves all basic principles of fluid dynamics, mass balance, and compressor characteristics. Much of the recent state of the art work in gas network model focuses on optimization problems in attempts to create a realistic gas network models through simulation processes.
For the design of electricity network, in particular electricity grid model, much research focuses on creating a realistic model for practical use. Medjroubi et al.[17] developed a way to model a realistic electricity grid using the open source data from OpenStreetMap, which helps to alleviate the common problem of data availability to a certain extent. The model provides a transparent way of providing assumptions made to fellow researchers as researchers in the public academic domain do not have access to the assumptions made by in-house researcher of critical infrastructures. It also provides simplification and documentation of the grid modelling method, which is neat in its way. Nardelli et al.[18] reviewed different electricity models used for modern smart grids, which determine both spatial and multilayer dynamics of a power system. The complexity (in the behaviour which results from the dynamics of the electricity grid) increases as moderation bring additional layers like the information network, renewable energy generation, making the electricity grid into a smart grid. Zhai et al.[19,20], Zhang et al.[21] and Zhai et al.[22-25] formulated a systematic way of tracing the source of cascading failure in a direct current (DC) electricity network through DC power flow equation. The initial disturbances causing a failure in one of the elements in a network might cause problems to other elements in the electricity network in the optimal control theory, and the magnitude of impact can be solved by the system of DC power flow equations.
When the coupling of gas-electricity network models is considered, several proposals have been made. The most common method is direct integrated formulation to achieve an integrated coupled energy system. They are modelled using dynamic market mechanism to evaluate the effect of gas fuel uncertainty and its economic effect[26,27]. Munoz et al.[28] modelled the coupled network based on gas network model and connecting the electricity portion through gas-power efficiency equation and not by the electricity grid network model. Shahidehpour et al.[29] also attempted to model the coupling in this way, which avoids the modelling the physical gas infrastructure, and the interdependency is only through the production cost of the gas-powered power plant. Quelhas et al.[30], Correa-Posada and Sánchez-Martín[31,32], Urbina and Li[33] and Jaworsky et al.[34] modelled the coupling of gas-electric network as two independent networks, in which the efficiency of the energy flow can be evaluated. However, the networks modelled do not contain most of the technical operating parameters of the network, which makes the research work less realistic. Other integration of both gas and electric networks[35,36] involves the modelling of gas system (involving pipeline equation, compression station equation, mass nodal balance equation, thermal formulation, etc.), electricity power system (involving the power flow model) and lastly the coupling method (through energy efficiency model). Recent concept of sector coupling[37] whereby the pathways from power source (i.e., fossil fuel) to transport, residential and industry sector are also becoming popular recently.
This work does not aim to fill up the current research gap of a coupled gas-electricity network as this research is quite mature. Instead, the main aim is to use a feasible and simplified model that can make full use of publicly available real data to simulate the coupled gas-electricity network.
For the analysis in this paper, the Singapore gas network [Figure 1A][38] and IEEE 24-bus power system [Figure 1B][39] are used to illustrate the interdependency between natural gas and electricity infrastructures. An integral formulation[29,31,33] for the steady-state analysis of the gas and electricity coupled infrastructure system is being considered toward the effect of disruption (e.g., pump failure in gas network) on both networks. Based on the disruption occurred in both networks, the economic losses are evaluated. The economic losses can then be used in critical infrastructure interdependency model to evaluate the cascading economic impact of all other critical infrastructure in a nation [Figure 2]. Thereafter, using the overall impact evaluated from the critical infrastructure interdependency model, the worst case scenario based on any disruption can be evaluated via simulation. Critical infrastructure interdependency model based on Leontief’s input-output model will be used to analyse the interdependencies of the critical infrastructure. Prior research using input-output (I/O) model for modelling critical infrastructure interdependencies[40-43] has proved the suitability of input-output model as a critical infrastructure interdependency model for this research. Using the method described above, the model can input realistic data from real open source public data. This will provide a good model to simulate how both systems are interdependent in the most simplified way possible, while simulating economic impact to a nation due to the simulated disruptions. This framework aims to simplify the simulation process to make it simpler and friendlier to researchers and potential stakeholders of the field.
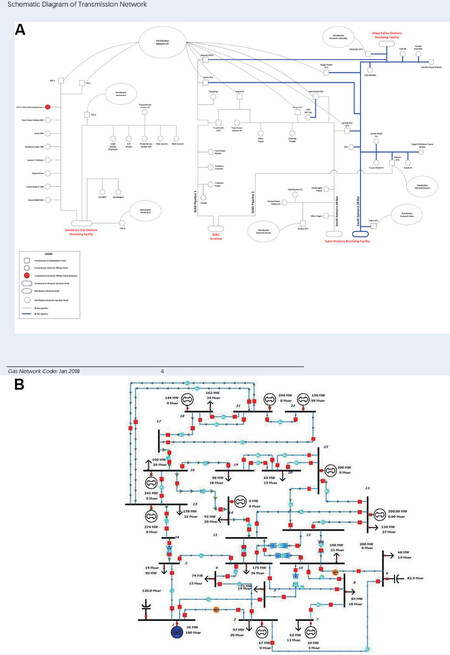
Figure 1. Schematic diagram of (A) gas transmission network and (B) IEEE 24 bus power system.
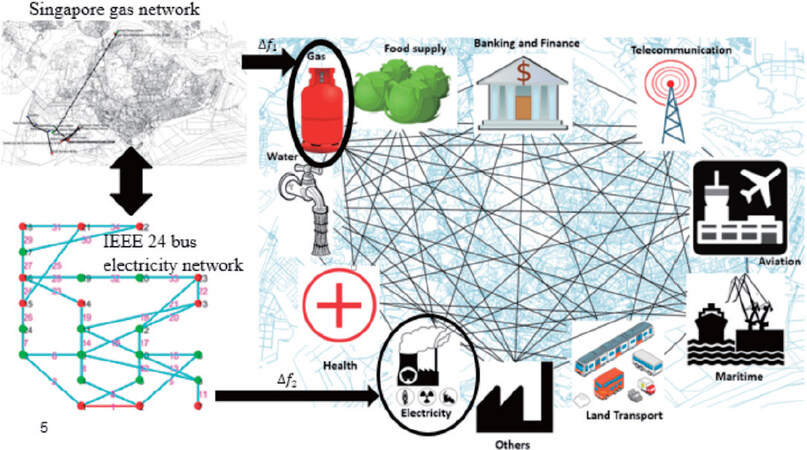
Figure 2. Propagation of critical infrastructure losses into input-output (I/O) interdependency model.
Models used
This section describes the model used to couple Singapore gas network and electricity grid, and how failure in gas network and electricity grid could result in larger economic losses.
Pipeline general flow model
In a high-pressure natural gas network, the compressors provide the pressure differences that maintain flow of the gas. However, in the context of Singapore, as the island nation is not very big in land size, compressor is not required. Therefore, the gas is pressurized at the supply’s source point (ORF) and subsequently flows through the pipeline directly to the gas sink point (power station).
A gas pipeline general flow equation[9,13] is used to model the gas network in Singapore,

Where PLin and PLout represent the pressure of the pipeline at the input and output point. For simplicity, constant 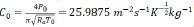 [13] is used. Note that λ represents the friction factor of the pipeline; ZL = 0.73 represents the gas compressibility factor in inlet/outlet of pipeline at 15 °C, specific gravity of 0.9; Δ* represents the relative density of gas; TL represents the gas temperature in pipeline (288.15 K); Q0 represents the volume flow of gas m3/s in standard state with the pressure 101,325 Pa and the temperature 293 K; L represents pipeline length (m) from source to sink based on their geographical location; and D represents the pipeline diameter (m).
The friction factor λ is calculated based on the following equation:

The relative density of gas Δ* is calculated by  , where HHV is the high heat value of gas, WI is the Wobbe Index of gas. Based on Singapore gas supply code, the Wobbe Index of Singapore natural gas is 52 MJ/m2 and the HHV of the natural gas is 50.3 MJ/m2. Therefore, Δ* = 0.9347 kg/m3. Based on the Singapore gas code, the diameter of the pipeline D is 0.6 m, density of air ρa = 1.225 kg/m3, the coefficient of dynamic viscosity of gas μ = 1.0037*10-5Ns/m2, and the pipe roughness Ψ = 0.046*10-3m. The flow rate, Q, is dependent on the needs of each power station and will be discussed in the next section.
The assumptions used in our gas network model are that the gas flows in an isothermal manner; there are no compressors due to short network in Singapore context; mass nodal balance is achieved throughout the period of gas transmission; and there is no contingency of alternative fuel.
Electricity grid DC power flow model
For simplicity, a DC power flow model[19-25] is used to model Singapore power grid system. DC power flow model is a suitable substitute for alternating current (AC) power flow in high voltage transmission network as DC model can help in reducing computation effort without sacrificing the validity of the results as compared to AC power flow model[44,45]. Zhai et al.[19,20], Zhang et al.[21] and Zhai et al.[22-25] modelled the state of the transmission line in a power system while computing the DC power flow to handle overloading problem in a power network. The cascade model that characterizes the connection state of the transmission line Bus i and Bus j is given by:
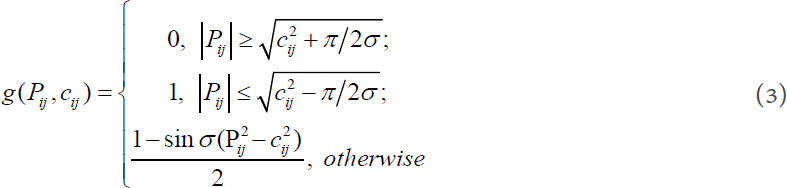
Where  and nb is the total number of buses in the DC power system. σ is a tunable positive parameter. Pij refers to the transmitted power on the transmission line that links Bus i and Bus j, and cij denotes its power threshold. g(Pij, cij) = 1 represents that the transmission line is in good condition while g(Pij, cij) = 0 will means the transmission line has been broken due to power overloading. The DC power flow model is given by:

where Pi represents the injection power of bus i; θi and θj represents the voltage phase angle of Bus i and j, respectively; Bij represents the mutual susceptance between Bus i and Bus j, where  .
.

The first part of the electricity network cost function Equation (5),  , is differentiable by
  and quantifies the power state or connectivity of power networks at the final step of cascading blackout where
  represents the admittance vector for the n transmission lines at the m-th step. The second part of Equation (5) characterizes the control energy at the first ι time steps with the constraint 1 ≤ ι ≤ (m - 1), uk = (uk,1, uk,2,..., uk,n)T denotes the control input on transmission lines, k, at each step. m is the total number of cascading steps in power networks, and ε is a small positive weight. The electricity network cost function
  of Equation (5) represents the power state or connectivity of power network, or the sum of element power at the end of cascading effect in the electricity network. Equation (5) will be used to evaluate the efficiency of the network.
The protection scheme used in this power grid model is the recurring protection scheme[25] used in Zhai’s 2019 paper in which the wide-area protection and control system takes remedial actions and implements corrective control measures by regulating the injected power on buses at two consecutive cascading steps (i.e., m step, m + 1 step). Only two consecutive steps are taken into consideration for protective actions, as protective actions on more cascading steps will greatly increase the computational complexity of the optimization problem, which is not the aim of this work. Recurring protection scheme allows load shedding and generation ramping/tripping while implementing the protection scheme. The generation ramping/tripping can be achieved by changing the injected power on the generator buses, while load shedding can be achieved by changing the injected power on load buses. The formulation of the recurring protection scheme can be found in Zhai’s 2019 paper[25].
Overall, the cascading failure process of power grids can be regarded as the outage model of branches that characterizes the redistribution of power flow and protective relays in power systems while the protection schemes ensure that the cascading failure process converges, stabilizing the power grids with the least cost.
The coupling of the cascading model and the DC power flow model enables us to find the potential issue when disturbances are introduced into the electricity grid in terms of the magnitude of disturbance that occurred at each transmission line or bus. Overloading might cause the fault of an electricity grid system, like the power outage that caused the blackout in Singapore in 2018. More details of the model can be found in Zhai et al.[19,20], Zhang et al.[21] and Zhai et al.[22-25].
Critical infrastructure interdependency input-output model
The Leontief I/O model is a quantitative economic model that expresses the interdependencies between all economic sectors in a country[40-43]. By using I/O model, researchers will be able to find the overall economic impact of a disruption to a nation through the introduction of disruption from any economic sector represented by its corresponding critical infrastructure. The I/O model requires the I/O table to work. In this paper, the 2014 Singapore input-output table[46] is used. Singapore input-output table are usually updated every 3-5 years, in which the tedious collection process will take another 1-2 years to collate all data from every single industry doing business in Singapore. The list of 71 economic sectors shown in 2014 Singapore input-output table are listed in Supplemenatry Material 1. All assumptions of the I/O model described in Lin’s papers[40-43] apply here.
The I/O model is formulated based on the demand-pull I/O quantity[47]. Assuming that the economy is categorised into n sectors, with xi representing the total output of sector i, zij representing intermediate sales by sector i to all other sectors j, and fi representing the final external demand for goods and services produced by sector i, the Leontief I/O model is formulated as follows:

Equation (6) describes how sector i supplies goods and services to sector j and satisfies the final external demand fi for sector i. Z represent the input-output table which consists of the flow of goods and services between each economic sector. After some matrix computation, equation (6) can be formulated as follows:

Details of how equation (7) can be arrived from equation (6) can be found in Lin’s papers[40-43]. The term (I - A)-1 is commonly known as the total requirement matrix of the I/O model and is also referred to as the interdependency matrix that determines the strength of dependency between critical infrastructure sectors[47] in this study. The greater the monetary transactions between two industry sectors in an economy, the more interconnected they are. The difference ΔX is the change in overall impact for all economic sectors due to the cascading impact from ΔF. The change in final external demand ΔF is used to estimate the initial impact due to a disruptive event [e.g., a disruptive event causing a power plant to be shutdown, resulting in the inability to satisfy external demand (ΔF) for electricity].
In this work, the gas network and the electricity grid are coupled based on the pipeline general flow model and the electricity grid DC power flow model presented. The drops in efficiency (or network performance as described in Lin’s paper[40-43]) of the coupled critical infrastructure network due to a disruption are evaluated. These drops in efficiency will be used as the input parameter of the critical infrastructure interdependency input-output model[40-43].
As a comparison, the main differences between this work and the work done by Lin[40-43] are:
The mathematical model of the two critical infrastructures used in this work are more realistic as compared to the previous topological network model.
The gas and electricity grid networks are coupled together by an energy efficiency model that will be described in a later section as compared to the previous non-coupling of two networks in Lin et al.[41] work.
As a result, this research is unique as it looks at the combination of (1) how the disruption to a coupled gas-power network could propagate within the coupled network while also looking at (2) the economic impact to a nation. This work is thus an improved research work of Lin et al.[41] and further researches on how I/O model could be used to evaluate economic impact across different sectors [Supplemenatry Material 1] in a nation, even if the industries are not physically connected. There are literatures of researches on two parts of the problem independently using different methods. However, this research work combines both parts and creates the framework to tackle economic impact described in the next section.
Methodology
The flow of this research work is shown in Figure 3. Firstly, the construction of gas and electricity networks needs to be finalized for use in the analysis. The parameter requirements for gas and electricity networks are explained in the previous section on models used. The general flow fluid model is implemented on the gas network while the DC power model is implemented on the electricity grid network.
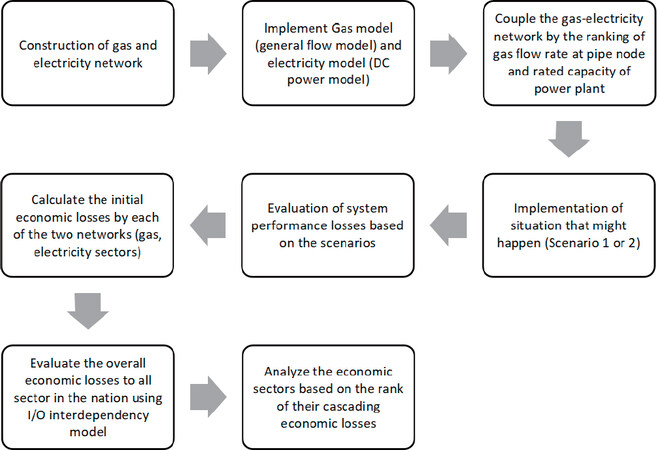
Figure 3. Flow of analysis.
The gas and electricity networks are coupled together accordingly to the flow rate of the gas at a pipe node and the rated capacity/generator power of a power plant in ranking manner; this is potentially the best way to couple both networks without knowing the real connection between them. The data of the coupled connection (gas-electricity network) are shown in Table 1. The 2D physical connection and the 3D view of Jurong Island section for the gas-electricity network are shown in Figure 4. The red pillar represents the interconnection of the gas and electricity network while black and green line presents gas and electricity network respectively in the 3D view of Figure 4. Figure 5 presents Singapore gas network with the gas off-take point labelled. There are 5 red nodes in Figure 5, representing the 5 input gas nodes in the network. This is just a way around the problem as most of the time, the exact connection and the coupling point to any known critical infrastructure are of national security concern and are thus not publicly available. Furthermore, the exact GIS location of gas and electricity entities are not usually released. Therefore, the GIS location of gas nodes and electricity nodes should not be viewed as the absolute location of the entities and should be viewed as a case study example. Connecting the gas and the electricity networks aims to simulate the scenario where the known highest gas output node will have the highest chance in providing the natural gas to the electricity node which has the highest rated capacity of power plant.
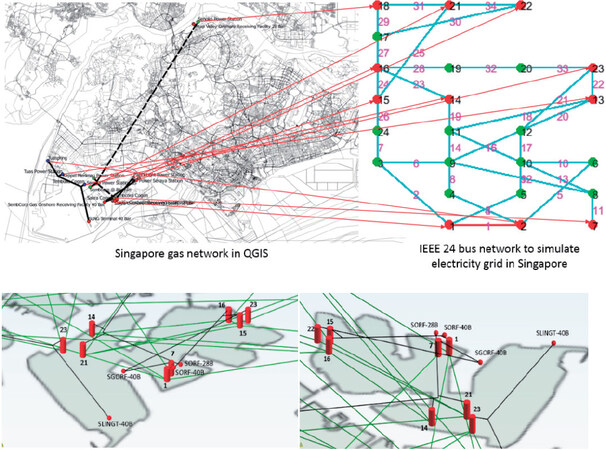
Figure 4. 2D view on coupled connection of gas-electricity network and the 3D view (with 2 different angle) of Jurong Island coupled network section.
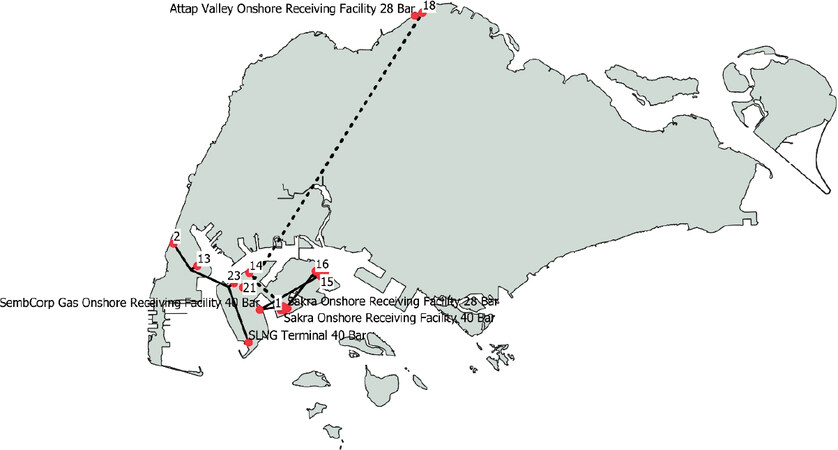
Figure 5. Singapore gas network with expanded view of Jurong Island gas network connection.
Coupled connection of gas-electricity network
| Ranking of gas supply node | Gas network node | Q0 m3/s | Ranking of rated capacity of the power station node | Electricity network node | P_D (Generator power) |
|---|---|---|---|---|---|
| 5 | 6 | 27.005 | 5 | 7 | 125 |
| 10 | 7 | 6.953 | 10 | 22 | 0 |
| 11 | 8 | 5.3015 | 11 | 23 | 0 |
| 3 | 9 | 48.708 | 3 | 13 | 265 |
| 8 | 10 | 13.618 | 8 | 2 | 97 |
| 6 | 11 | 27.005 | 6 | 1 | 108 |
| 2 | 12 | 51.027 | 2 | 15 | 317 |
| 7 | 13 | 26.508 | 7 | 16 | 100 |
| 9 | 14 | 13.254 | 9 | 21 | 0 |
| 4 | 15 | 44.400 | 4 | 14 | 194 |
| 1 | 16 | 92.777 | 1 | 18 | 333 |
Due to the coupled connections as shown in Figure 4, an energy efficiency formula is used:

Where P represents the power generated from the fuel in Joules/second or Watts (W), HHV represents the high heat value or gross heating value of the fuel input, efficiency represents the efficiency of the combined cycle gas turbine (CCGT) system, and Q0 represents the flow of natural gas input into the CCGT system. The gas parameters follow the Singapore Gas supply code[38]. The energy efficiency formula is used to convert the natural gas input, Q0, at the gas node into the power generated output, P, at the electricity node.
Based on Figure 3, the next step will be to implement scenarios that might potentially happen. The two scenarios that are being modelled are described as the following:
Scenario 1: Failure at gas source point (e.g., gas leakage at gas source or along the pipeline)
In order to maintain the amount of gas flow that is required by a power station (by capacity of the power station),  where
where  , PLout = 0. By evaluating the threshold of PLin for all nodes in the gas network based on 4 main gas source pipelines, the outcome will evaluate which gas node (and corresponding power station) is the limiting factor if PLin drops to a terminal state and starts to cause problem (insufficient natural gas supplied to power plant to produce the amount of electricity required by the country).
Scenario 2: Failure at gas sink point (e.g., gas not supplied to a particular power station)
This failure happens at the gas output (PLout) point (power station). The evaluation will only take into account the gas flow (Q0) into the power station and do not require general flow fluid model to simulate the gas network. 1, 2 and 3 gas node combinations will fail simultaneously, which accounts for the corresponding effect on electricity model, and the economic impact to the country.
One main assumption made in this analysis is that the 4 main gas pipelines are not connected and do not supplement one another if an event occurs at either gas pipeline. This is because each pipeline and its connecting gas off-take point are normally bound by contracts. Although gas pipeline might be interconnected somewhere in the network, the gas off-take point will only be obliged to consume the gas in their own pipeline sourced by their individual gas supplier. Gas taken from other pipelines is subject to heavy penalty according to the Singapore gas code.
Results
In this section, the simulated results for scenarios 1 and 2 will be presented:
Scenario 1: Failure at gas source point (e.g., gas leakage at gas source or along the pipeline)
Due to simulated failure at gas source point, the pressure in each of the 4 main gas pipelines drops, causing disruptions to power generation in the electricity network because of insufficient flow of natural gas to fire up the power plant at the correct electricity output rate. Table 2 presents the critical pressure threshold for the 4 main gas pipelines with the limiting power station being “marked with an asterisk*” under the limiting power station column. Do note that the first 3 gas pipelines serving gas node 6 to 13 are rated at 40-bar pressure, while the last gas pipeline serving gas node 14 to 16 is rated at 28-bar pressure. The simulated drop of pressure is set at 10,000 Pa intervals from the rated pipeline pressure (e.g., 4,000,000 Pa, 3,990,000 Pa, 3,980,000 Pa, etc.) to 0 Pa in the pipeline to simulate the effect of pressure drop in the pipeline.
Critical pressure threshold of each gas pipeline @ HHV = 50.3 MJ/m3
| Pipeline | ID | Gas node serving power station | Flow rate (m3/s) | Critical pressure threshold (Pa) | Limiting power station |
|---|---|---|---|---|---|
| Pipeline 1 (Sembcorp gas onshore 40 bar) | 6 | Sembcorp Cogen | 27.00 | 132,727 | * |
| 7 | Power Seraya Station (Jurong power station) | 6.96 | 71,769 | ||
| Pipeline 2 (SLNG 40bar) | 8 | Tembusu Cogen (Tuas power) | 5.30 | 54,149 | |
| 9 | Tuas Power Station | 48.71 | 597,537 | * | |
| 10 | Tuaspring | 13.62 | 188,868 | ||
| Pipeline 3 (Sakra onshore 40 bar) | 11 | Sakra Cogen (Pulau Sakra power station) | 27.00 | 58,684 | |
| 12 | Seraya Power Station | 51.03 | 438,764 | * | |
| 13 | PacificLight Power Station | 26.51 | 223,447 | ||
| Pipeline 4 (Sakra onshore 28 bar) | 14 | Sembcorp @ Banyan | 13.25 | 119,953 | |
| 15 | Keppel Merlimau Power Station | 44.40 | 385,941 | * | |
| 16 | Senoko Power Station | 92.78 | 370,983 |
Figure 6 presents the linkages of pipeline 1 (based on Sembcorp gas onshore 40-bar receiving facility) and its corresponding “Cost function vs. Pressure vs. Overall economic losses” graph. The results of the simulation model are presented in Supplemenatry Material 2. As critical pressure is reached and decreases further, the flowrate of natural gas in the pipeline will be affected (e.g., pipeline leakage). This graph is interesting because it shows the region where the critical pressure starts to cause negative effect to the cost function of electricity grid and the corresponding economic losses to the nation. Do note that the blue-dotted line represents the overall economic losses on the right grid of the graph in Figure 6, while the red-dotted line represents the cost function of electricity on the left grid of the graph in Figure 6. Pressure reading decreases from right towards left based on the bottom grid of the graph in Figure 6. As the pressure drops to 132,727 Pa in pipeline 1, Sembcorp Cogen will be the first power station to be affected by the pressure drop due to insufficient natural gas flow rate into the power station. The first red vertical line at 132,727 Pa on the right in Figure 6 indicates the critical point where overall economic losses to the nation starts to increase due to a drop in cost function in electricity grid. As the drop in pressure deteriorates further, the next critical pressure 71,769 Pa of Power Seraya Station (refer to Table 2) is reached as indicated by the second red vertical line on the graph in Figure 6. When the pressure in pipeline 1 reaches 0 Pa, the overall economic losses will reach $2,206,935 per day to Singapore based on critical infrastructure interdependency model analysis.
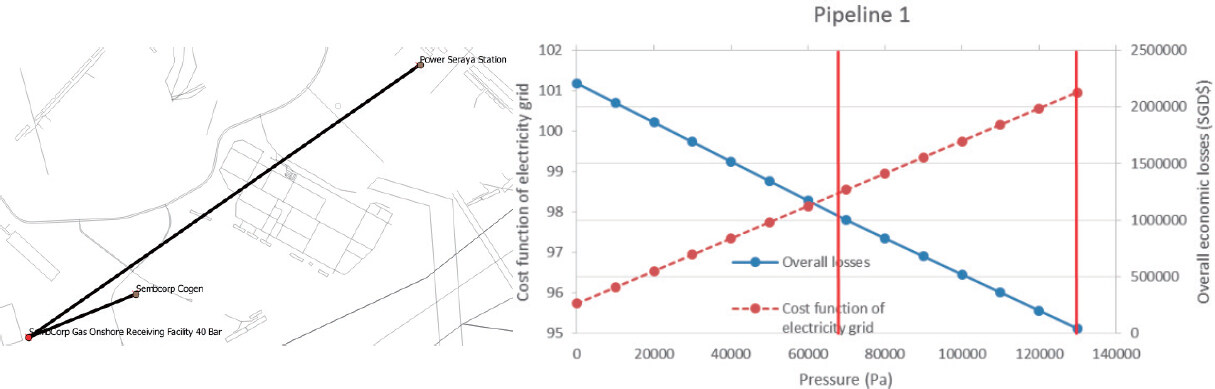
Figure 6. Pipeline 1 (Sembcorp gas onshore 40-bar) with cost function of electricity grid vs. pressure vs. economic losses.
Figure 7 presents the linkages of pipeline 2 (based on SLNG 40-bar onshore receiving facility) and its corresponding “Cost function vs. Pressure vs. Overall economic losses” graph. As there are 3 gas nodes connecting to power stations along pipeline 2 (SLNG pipeline), there are 3 critical pressure points in the “Cost function vs. Pressure vs. Overall economic losses” graph. The first initial critical pressure starts to occur at 597,537 Pa where overall economic losses are first incurred when pressure drops below this pressure level. Further economic losses occur at a slightly more accelerated rate at the second and third critical pressure point of 188,867 Pa and 54,149 Pa, respectively. When the pressure in pipeline 2 reaches 0 Pa, the overall economic losses will reach $4,630,359 per day to Singapore based on critical infrastructure interdependency model analysis. When pipeline 2 [Figure 7] is compared with pipeline 1 [Figure 6], it is obvious that pipeline 2 is of more significant due to higher overall economic losses when pressure in the pipeline is completely lost.
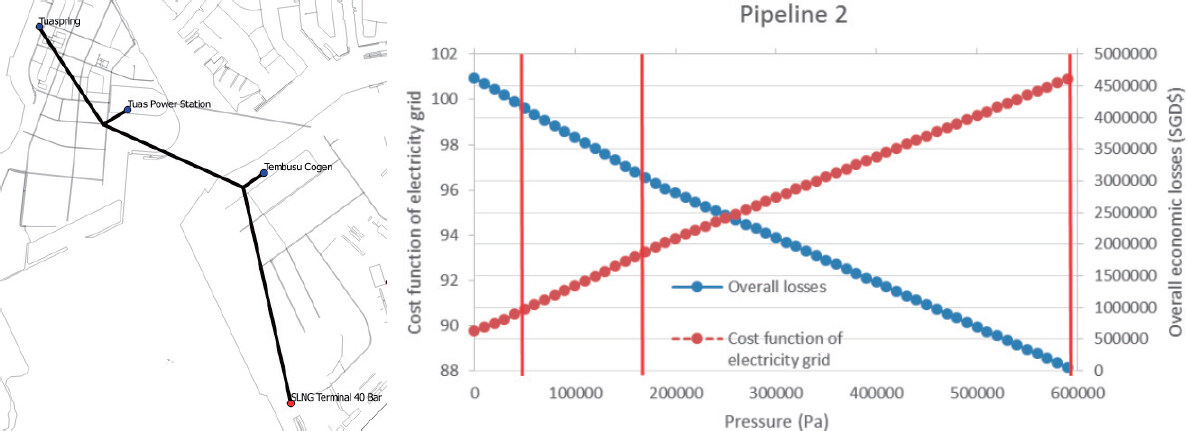
Figure 7. Pipeline 2 (SLNG 40-bar) with cost function of electricity grid vs. pressure vs. economic losses.
Figure 8 presents the linkages of pipeline 3 (based on Sakra onshore receiving facility 40-bar) and its corresponding “Cost function vs. Pressure vs. Overall economic losses” graph. As there are 3 gas nodes connecting to power stations along pipeline 3 (SLNG pipeline), there are 3 critical pressure points in the “Cost function vs. Pressure vs. Overall economic losses” graph. The first initial critical pressure first occurs at 438,764 Pa where overall economic losses starts to be incurred when pressure drops below this pressure level. Further economic losses occur at a slightly more accelerated rate at the second and third critical pressure point of 223,447 Pa and 58,684 Pa, respectively. When the pressure in pipeline 3 reaches 0 Pa, the overall economic losses will reach $6,808,967 per day to Singapore based on critical infrastructure interdependency model analysis. When pipeline 3 [Figure 8] is compared with pipeline 1 [Figure 6] and pipeline 2 [Figure 7], pipeline 3 is of more significant due to higher overall economic losses when pressure in the pipeline is completely lost. Moreover, the drastic increase of overall economic losses when pressure drops below 58,684 Pa shows the pipeline’s criticality.
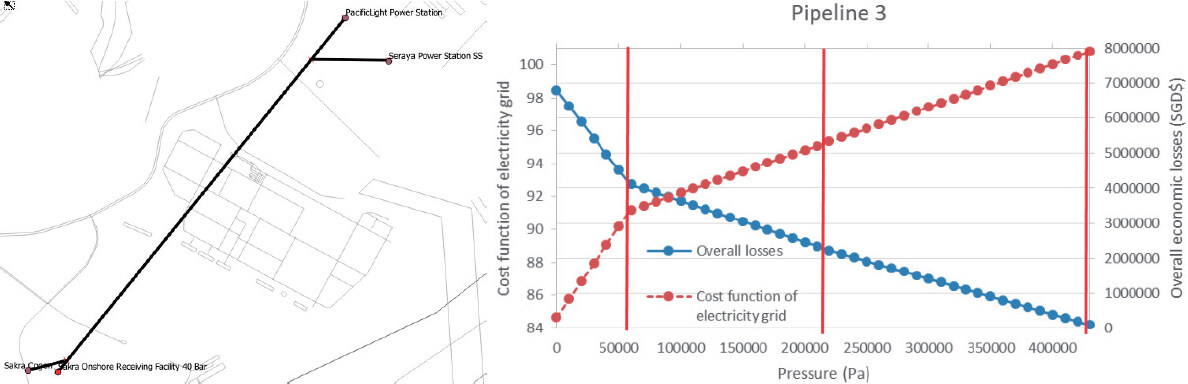
Figure 8. Pipeline 3 (Sakra onshore 40-bar) with cost function of electricity grid vs. pressure vs. economic losses.
Figure 9 presents the linkages of pipeline 4 (based on Sakra onshore receiving facility 28-bar and Attap Valley onshore receiving facility 28-bar) and its corresponding “Cost function vs. Pressure vs. Overall economic losses” graph. As there are 3 gas nodes connecting to power stations along pipeline 4 (SLNG pipeline), there are 3 critical pressure points in the “Cost function vs. Pressure vs. Overall economic losses” graph. The first initial critical pressure starts to occur at 385,941 Pa where overall economic losses starts to be incurred when pressure drops below this pressure level. Further economic losses occur at a slightly more accelerated rate at the second and third critical pressure point of 370,983 Pa and 119,953 Pa, respectively. When the pressure in pipeline 3 reaches 0 Pa, the overall economic losses will reach $11,658,859 per day to Singapore based on critical infrastructure interdependency model analysis. When pipeline 4 [Figure 9] is compared with pipeline 1 [Figure 6], pipeline 2 [Figure 7] and pipeline 3 [Figure 8], pipeline 4 is of more significance due to higher overall economic losses when pressure in the pipeline is completely lost. This pipeline is unique as it was the earliest known natural gas pipeline built in Singapore, having 2 input points to serve 3 output points within the pipeline. Pipeline 4 is the only natural gas pipeline that cut across Singapore from north to south-west and is also serving Singapore largest power plant, Senoko Power Plant. The updated gas code in Singapore has a natural gas pipeline standard of 40-bar after this pipeline was built. However, the updated gas code is not applicable to this pipeline as there would be complication on implementation from 28-bar to 40-bar. Plans on upgrading the pipeline is in discussion but will take a while before its implementation.
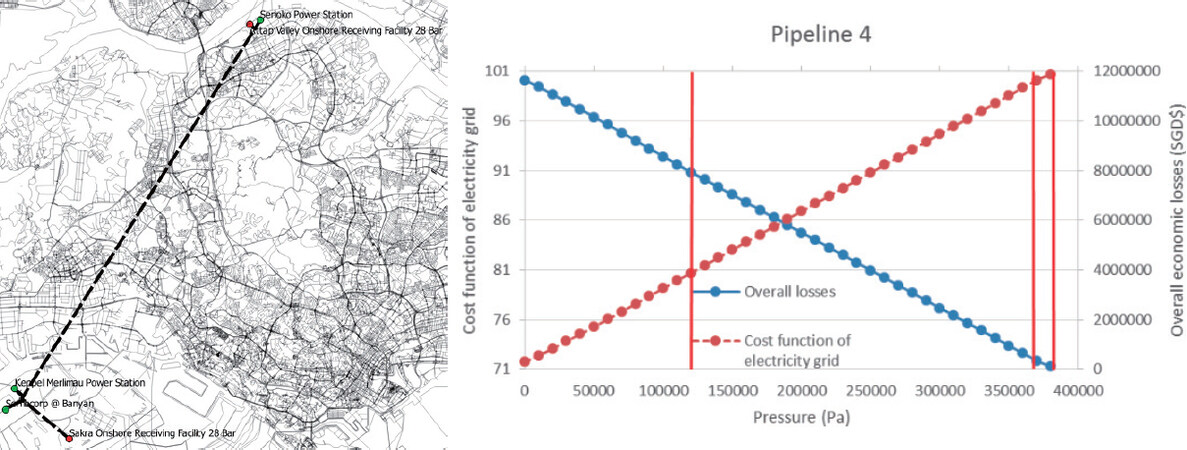
Figure 9. Pipeline 4 (Sakra onshore 28-bar & Attap Valley onshore 28-bar) with cost function of electricity grid vs. pressure vs. economic losses.
Scenario 2: Failure at gas sink point (e.g., gas not supplied to a particular power station)
In this scenario, the work will simulate a complete stoppage of natural gas supply to the power station via its connecting gas node. A complete and exhaustive search of 1, 2, and 3 gas nodes combination simultaneously cut off are simulated while evaluating the corresponding economic impact due to the stoppage of gas supply. This scenario will utilize the electricity cost function and the gas flow rate as a means to determine the drop in network efficiency to both gas and electricity networks. With the network efficiency deterioration, the drop in demand for gas and electricity sectors can be determined and used in the I/O model to evaluate the overall losses and cascading impact due to this disruption.
For Scenario 2, the sample case impacting electricity grid nodes 1, 2, and 7, illustrated in Figure 10, will be examined to demonstrate how the evaluation process works. Table 3 describes the case in Figure 10 in terms of the affected gas node and the connected electricity node.
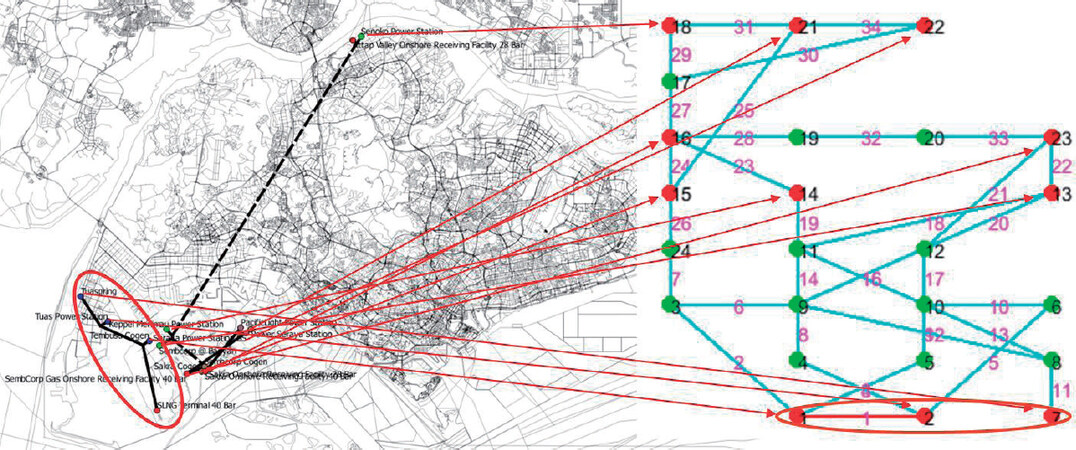
Figure 10. Sample case of 3 gas nodes failure along SLNG pipeline causing electricity grid nodes 1, 2, and 7 to be affected.
Sample case of 3 gas nodes cut off from supply and the connecting electricity nodes associated
| ID | Gas node | Capacity, P (MW) | Flow rate, Qo, (m3/s) | Gas source | Total flow rate, (m3/s) | Corresponding linked node in IEEE 24-bus system | Active power in bus |
|---|---|---|---|---|---|---|---|
| 10 | Tuaspring | 411 | 13.618 | SLNG Terminal 40-Bar | 67.63 | 7 | P_D drops to zero |
| 9 | Tuas Power Station | 1470 | 48.708 | 2 | P_D drops to zero | ||
| 8 | Tembusu Cogen (Tuas power) | 160 | 5.302 | 1 | P_D drops to zero |
Using the information provided requires prior preparation. Table 4 tabulates the drop in network efficiency due to the loss of 3 electricity and gas nodes in the network, the electricity and gas market rate for 2016 Singapore and the losses of electricity and gas sectors per day.
Economic losses in electricity and gas sector per market rate in Singapore due to drop in network efficiency
| Cost function of electricity network | Total flow rate of natural gas network (m3/s) | |
|---|---|---|
| Case 0 (normal state) | 101.06 | 356.56 |
| Sample case | 95.15 | 288.93 |
| Drop in efficiency, % | 5.848 | 18.967 |
| Electricity | Natural gas | |
| Price @ 2016 SGD$ | 18.5 cents/kWh | 3.445 per million BTU |
| Cost per year @ 2016 SGD$ | 9,543,521,000 | 1,143,455,784 |
| Cost per day @ 2016 SGD$ | 26,146,633 | 3,132,756 |
| Losses in sector/day due to drop in efficiency SGD$ | 1,529,058 | 594,201 |
Using the economic losses per day in electricity and gas sectors in Table 4 as input to the I/O model using 2014 Singapore I/O Table, the overall and cascading losses to Singapore can be evaluated. Figure 11 shows the top 10 highest cascading losses in economic sectors due to the drop in efficiency across electricity and gas sectors. While Table 5 shows the overall amount of cascading losses, the losses are divided into the overall losses per sector due to electricity disruption and gas disruption, respectively, for easier references in Figure 11.
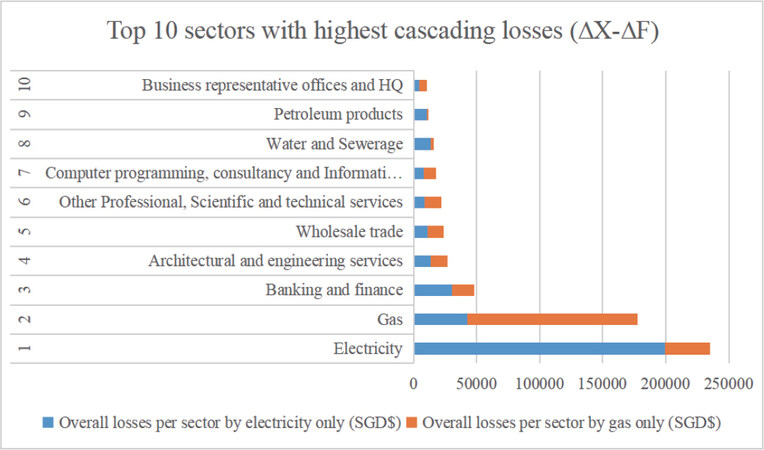
Figure 11. Top 10 sectors in Singapore with highest cascading impact due to disruption in electricity and gas sectors.
Overall and cascading economic losses to Singapore based on 2014 Singapore I/O Model
| 2014 SG I/O table | Electricity sector | Gas sector |
|---|---|---|
| Initial losses, Δfi, SGD$ | 1,529,058 | 594,201 |
| Final losses, Δxi, SGD$ | 1,763,937 | 771,775 |
| All economic sectors in Singapore | ||
| Overall losses to all sector in SG, ΔX, SGD$ | 2,858,305 | |
| Cascading losses due to initial losses, (ΔX - ΔF), SGD$ | 735,046 | |
All cases of 1, 2, and 3 gas nodes combination have been analysed in the same way as Tables 3-5 and Figure 11. For one gas node disruption combination, 11 cases have been evaluated as there are a total of 11 gas output nodes. Table 6 shows the top 10 cases of node combination with the corresponding connected electricity node and the overall losses incurred if the disruption of the gas node happens. Figure 12 illustrates the top 10 sectors with the highest economic cascading losses based on the worst case scenario (Case 11) for one gas node combinations.
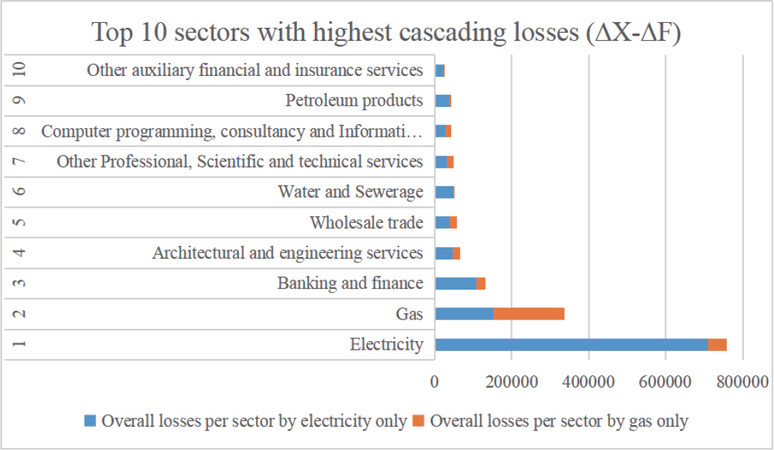
Figure 12. Top 10 sectors with highest cascading losses (Case 11) for one-node disruption in gas network.
Top 10 cases for one-node disruption in gas network in terms of overall economic losses
| Rank in ascending order | Case | Gas node disrupted | Power node disrupted | Overall losses (SGD$) |
|---|---|---|---|---|
| 1 | 11 | 16 | 18 | 8,175,771 |
| 2 | 7 | 12 | 15 | 4,449,830 |
| 3 | 4 | 9 | 13 | 4,183,794 |
| 4 | 10 | 15 | 14 | 3,230,345 |
| 5 | 1 | 6 | 7 | 2,112,584 |
| 6 | 8 | 13 | 16 | 1,947,059 |
| 7 | 5 | 10 | 2 | 376,367 |
| 8 | 6 | 11 | 1 | 366,692 |
| 9 | 9 | 14 | 21 | 180,236 |
| 10 | 2 | 7 | 22 | 94,870 |
For two gas nodes disruption combination, 55 cases have been evaluated due to the combination of 11 gas output nodes. Table 7 shows the top 10 cases of node combinations with the corresponding connected electricity node, and the overall losses incurred if the disruption of the gas node happens. Figure 13 illustrates the top 10 sectors with the highest economic cascading losses based on the worst case scenario (Case 34) for two gas node combinations.
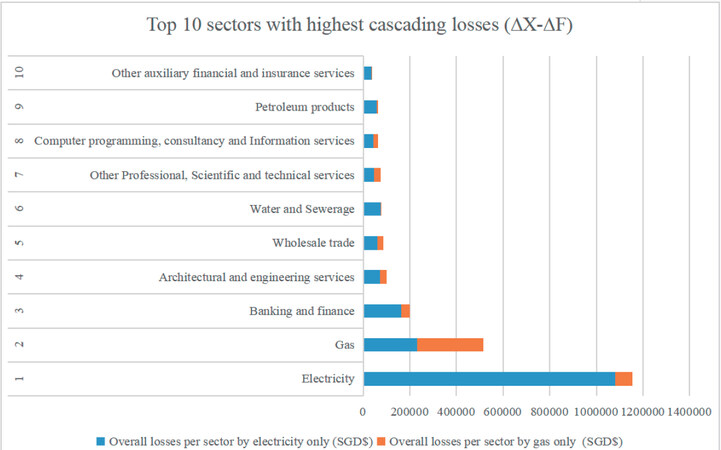
Figure 13. Top 10 sectors with highest cascading losses (Case 34) for two-node disruption in gas network.
Top 10 cases for two-node disruption in gas network in terms of overall economic losses
| Rank in ascending order | Case | Gas node disrupted | Power node disrupted | Overall losses (SGD$) | ||
|---|---|---|---|---|---|---|
| 1 | 34 | 9 | 16 | 13 | 18 | 12,454,514 |
| 2 | 49 | 12 | 16 | 15 | 18 | 12,337,822 |
| 3 | 55 | 15 | 16 | 14 | 18 | 11,479,142 |
| 4 | 10 | 6 | 16 | 7 | 18 | 10,303,134 |
| 5 | 52 | 13 | 16 | 16 | 18 | 10,267,572 |
| 6 | 30 | 9 | 12 | 13 | 15 | 8,667,808 |
| 7 | 40 | 10 | 16 | 2 | 18 | 8,557,899 |
| 8 | 45 | 11 | 16 | 1 | 18 | 8,541,945 |
| 9 | 54 | 14 | 16 | 21 | 18 | 8,355,488 |
| 10 | 19 | 7 | 16 | 22 | 18 | 8,270,122 |
For three gas node disruption combinations, 165 cases have been evaluated due to the combination of 11 gas output nodes. Table 8 shows the top 10 cases of node combinations with the corresponding connected electricity node and the overall losses incurred if the disruption of the gas node happens. Figure 14 illustrates the top 10 sectors with the highest economic cascading losses based on the worst case scenario (Case 124) for three gas node combination.
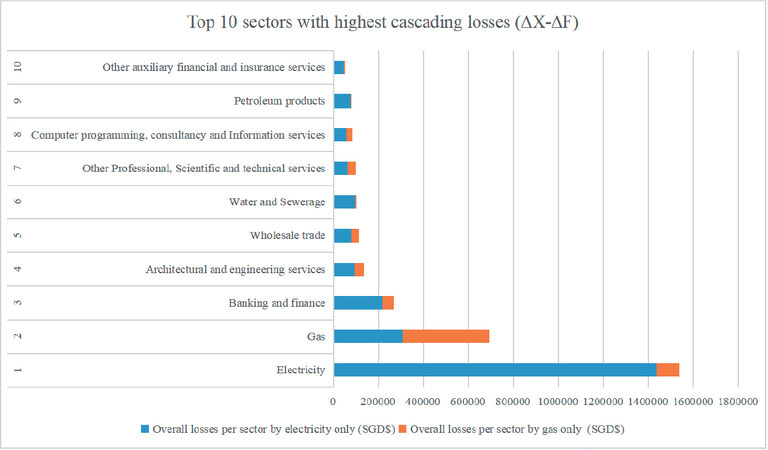
Figure 14. Top 10 sectors with highest cascading losses (Case 124) for three-node disruption in gas network.
Top 10 cases for three-node disruption in gas network in terms of overall economic losses
| Rank in ascending order | Case | Gas node disrupted | Power node disrupted | Overall losses (SGD$) | ||||
|---|---|---|---|---|---|---|---|---|
| 1 | 124 | 9 | 12 | 16 | 13 | 15 | 18 | 16,616,565 |
| 2 | 130 | 9 | 15 | 16 | 13 | 14 | 18 | 15,757,885 |
| 3 | 161 | 12 | 15 | 16 | 15 | 14 | 18 | 15,641,194 |
| 4 | 24 | 6 | 9 | 16 | 7 | 13 | 18 | 14,581,877 |
| 5 | 127 | 9 | 13 | 16 | 13 | 16 | 18 | 14,546,315 |
| 6 | 39 | 6 | 12 | 16 | 7 | 15 | 18 | 14,465,186 |
| 7 | 158 | 12 | 13 | 16 | 15 | 16 | 18 | 14,345,864 |
| 8 | 45 | 6 | 15 | 16 | 7 | 14 | 18 | 13,606,506 |
| 9 | 164 | 13 | 15 | 16 | 16 | 14 | 18 | 13,570,944 |
| 10 | 115 | 9 | 10 | 16 | 13 | 2 | 18 | 12,836,641 |
On the whole, under scenario 2, if the correct gas node combination (1-, 2-, and 3-node combinations) has been selected, it may cause a drastic impact to the economic. This scenario could be used as a testbed to simulate which is the worst case scenario and which is the problematic node out of the 1-, 2-, and 3-node combinations. Node 16 seems to be the problematic gas node, as it seems to appear as the top in one-node disruption case, while featuring constantly throughout the top 10 of two-node disruption cases and once again, appearing in all top 10 of three-node disruption cases. Gas node 16 would require a special attention if researchers have limited resources to mitigate all possible risks in economic loss. Overall, this scenario illustrates how the gas and the electricity sectors affect the national economy. The electricity sector has a bigger pie in terms of its effect on the economy. However, the upstream sector is gas sector for electricity generation and becomes very critical to the electricity sector if a major disruption happens to the gas sector. It is very obvious nowadays that electricity/power plant acts as critical infrastructure in the function of modern society; it will cause a lot of disruption, inconvenience and even danger if electricity security is not taken care of.
Discussion
This work has analyzed the cascading impact of the known multiple critical infrastructure sectors in a country. The work also provides insights into the economic impact on a country when a disruption on critical infrastructures happens (considering the interdependency of critical infrastructures) and provides information about the amount and ranking of cascading losses for all economic sectors in a country due to a prescribed disruption. For insurers and reinsurers, the results show their usefulness as part of catastrophe risk modelling and product pricing, in which the model could be used to simulate a range of different scenarios.
The advantage of modelling multiple critical infrastructures through the coupling of the gas and the electricity models via an energy efficiency model is the ability to model physical critical infrastructures in a more realistic and interconnected manner. However, the challenge of coupling multiple critical infrastructures is the ability to find a suitable physical model to suit the critical infrastructure and to find an interconnecting model to link two different critical infrastructures together. Moreover, as more critical infrastructures (3 or more, e.g.) are linked together, the chance is high for the overall encompassing model to become too complex. There may also be unknown linkages between two different critical infrastructures (e.g., gas and telecommunication critical infrastructures) which make the work more complex. The only option is probably to fall back to the usage of critical infrastructure interdependency input-output model and the pure modelling of critical infrastructure independently without any physical linkage between critical infrastructures. The usage of critical infrastructure interdependency input-output model will provide a basic linkage between all economic sectors which technically are able to help assist modelers if they are unable to visualize and model the unknown linkages among the infrastructure systems.
Using Singapore as an example, the reliance on gas and electricity has created positivity and negativity. The main motivations for using gas as the major source of power for electricity are the environmentally friendly nature as compared to fossil fuels, like crude oil or coal power generation, and the cost-effective nature of using gas than fossil fuels. Gas has been quite readily available from Singapore’s neighboring countries and with the introduction of LNG and Singapore’s building of massive supporting infrastructure to become a regional LNG hub, it is inevitable that LNG will be the trend of the future. However, with security in mind, the fact that Singapore doesn’t have any natural resource to self-produce electricity could mean that Singapore heavily relies on imported fuel resources. To make things worse, as of February 2020, plans are in place to stop natural gas supply to Singapore by 2023 as Indonesia intends to divert its natural gas for domestic market usage. Singapore could be in a more challenging situation (in terms of electricity security) given the development trend of its neighboring countries. For now, LNG seems to be one of Singapore’s possible solutions to fuel sustainability. However, things might change again as LNG depends on shipment, and stoppage of shipping route may also happen.
The work can also be further improved by using a more accurate electricity grid model and a gas pipeline model, and a suitable model that can couple both model together. However, such model might become very complex and increase the difficulty of usage to modeler. IEEE 24 bus electricity grid can also be replaced by a more realistic electricity grid to improve the model’s accuracy if the design and schematic of the electricity grid is available.
Declarations
AcknowledgmentsThe authors wish to thank the anonymous reviewers for their constructive comments and valuable suggestions.
Authors’ contributionsMade substantial contributions to the conception and design of the research work and performed data gathering and analysis work: Lin J
Provided research guidance and contributed directly to the research work: Pan TC
Availability of data and materialsNot applicable.
Financial support and sponsorshipInstitute of Catastrophe Risk Management, Nanyang Technological University, Singapore.
Conflicts of interestAll authors declared that there are no conflicts of interest.
Ethical approval and consent to participateNot applicable.
Consent for publicationNot applicable.
Copyright© The Author(s) 2021.
REFERENCES
1. Thacker S, Pant R, Hall JW. System-of-systems formulation and disruption analysis for multi-scale critical national infrastructures. Reliability Engineering & System Safety 2017;167:30-41.
2. Tai K, Kizhakkedath A, Lin J, et al. Identifying extreme risks in critical infrastructure interdependencies. In: Campbell P, Perez P, editors. Proceedings of the International Symposium of Next Generation Infrastructure, 2013 Oct 1-4 .
3. Bronger D. Megastädte. Geographische Rundschau 1996;48:74-81.
4. Central Intelligence Agency. The CIA world factbook 2018 United States: Skyhorse; 2018.
5. Report of the energy system review committee. Availible from: https://www.nas.gov.sg/archivesonline/data/pdfdoc/20050317987.htm [Last accessed on 6 Dec 2021].
6. NSCS. Pick & Ponder Singapore: NSCS; 2017.
7. CNA. Blackouts hit multiple estates across Singapore; power restored to all areas, says SP Group, in Channel News Asia 2018: Singapore. Availible from: https://news.nestia.com/detail/-/301962 [Last accessed on 6 Dec 2021].
8. EMA. Piped Natural Gas and Liquefied Natural Gas. Available from: https://www.ema.gov.sg/Piped_Natural_Gas_and_Liquefied_Natural_Gas.aspx [Last accessed on 6 Dec 2021].
9. Demissie A, Zhu W, Belachew CT. A multi-objective optimization model for gas pipeline operations. Comput Chem Eng 2017;100:94-103.
10. Babonneau F, Nesterov Y, Vial J. Design and operations of gas transmission networks. Oper Res 2012;60:34-47.
11. Üster H, Dilaveroğlu Ş. Optimization for design and operation of natural gas transmission networks. Appl Energy 2014;133:56-69.
12. Arya AK, Honwad S. Multiobjective optimization of a gas pipeline network: an ant colony approach. J Petrol Explor Prod Technol 2018;8:1389-400.
13. Ruan Y, Liu Q, Zhou W, et al. A procedure to design the mainline system in natural gas networks. Appl Math Model 2009;33:3040-51.
14. Ríos-mercado RZ, Kim S, Boyd EA. Efficient operation of natural gas transmission systems: a network-based heuristic for cyclic structures. Comput Chem Eng 2006;33:2323-51.
15. Kabirian A, Hemmati MR. A strategic planning model for natural gas transmission networks. Energy Policy 2007;35:5656-70.
16. Woldeyohannes AD, Majid MAA. Simulation model for natural gas transmission pipeline network system. Simul Model Pract Theory 2011;19:196-212.
17. Medjroubi W, Müller UP, Scharf M, Matke C, Kleinhans D. Open data in power grid modelling: new approaches towards transparent grid models. Energy Rep 2017;3:14-21.
18. Nardelli PH, Rubido N, Wang C, et al. Models for the modern power grid. Eur Phys J Spec Top 2014;223:2423-37.
19. Zhai C, Zhang H, Xiao G, et al. Modeling and identification of worst-case cascading failures in power systems. arXiv preprint arXiv 2017;1703.05232.
20. Zhai C, Zhang H, Xiao G, Pan TC. Comparing different models for investigating cascading failures in power systems. 2017 International Workshop on Complex Systems and Networks (IWCSN); 2017 Dec 8-10 Doha, Qatar: IEEE; 2017. pp. 230-6.
21. Zhang H, Zhai C, Xiao G, Pan T. Identifying critical risks of cascading failures in power systems. IET Gener Transm Distrib 2019;13:2438-45.
22. Zhai C, Nguyen HD, Xiao G. A robust optimization approach for protecting power systems against cascading blackouts. Electr Power Syst Res 2020;189:106794.
23. Zhai C, Xiao G, Meng M, Zhang H, Li B. Identification of catastrophic cascading failures in protected power grids using optimal control. J Energy Eng 2021;147:06020001.
24. Zhai C, Xiao G, Zhang H, Wang P, Pan T. Identifying disruptive contingencies for catastrophic cascading failures in power systems. Int J Electr Power Energy Syst 2020;123:106214.
25. Zhai C, Zhang H, Xiao G, Pan T. A model predictive approach to protect power systems against cascading blackouts. Int J Crit Infrastruct 2019;113:310-21.
26. Li T, Eremia M, Shahidehpour M. Interdependency of natural gas network and power system security. IEEE Trans Power Syst 2008;23:1817-24.
27. Jenkins S, Annaswamy A, Hansen J, Knudsen J. A dynamic model of the combined electricity and natural gas markets. 2015 IEEE Power & Energy Society Innovative Smart Grid Technologies Conference (ISGT); 2015 Feb 18-20 Washington, DC, USA: IEEE; 2015. pp. 1-5.
28. Muñoz Estrada J, Jiménez Redondo N, Pérez Ruiz J, Barquín Gil J. Natural gas network modeling for power systems reliability studies. 2003 IEEE Bologna Power Tech Conference Proceedings; 2003 Jun 23-26 Bologna, Italy: IEEE; 2003. p. 8.
29. Shahidehpour M, Yong Fu, Wiedman T. Impact of natural gas infrastructure on electric power systems. Proc IEEE 2005;93:1042-56.
30. Quelhas A, Gil E, Mccalley JD, Ryan SM. A multiperiod generalized network flow model of the U.S. integrated energy system: part I - model description. IEEE Trans Power Syst 2007;22:829-36.
31. Correa-posada CM, Sanchez-martin P. Integrated power and natural gas model for energy adequacy in short-term operation. IEEE Trans Power Syst 2015;30:3347-55.
32. Correa-posada CM, Sanchez-martin P. Security-constrained optimal power and natural-gas flow. IEEE Trans Power Syst 2014;29:1780-7.
33. Urbina M, Li Z. Modeling and analyzing the impact of interdependency between natural gas and electricity infrastructures. 2008 IEEE Power and Energy Society General Meeting-Conversion and Delivery of Electrical Energy in the 21st Century; 2008 Jul 20-24 Pittsburgh, PA, USA: IEEE; 2008. pp. 1-6.
34. Jaworsky C, Spataru C, Turitsyn K. Vulnerability assessment for interdependent gas and electricity networks. 2015 48th Hawaii International Conference on System Sciences; 2015 Jan 5-8 Kauai, HI, USA: IEEE; 2015. pp. 2766-75.
35. Martinez-mares A, Fuerte-esquivel CR. A unified gas and power flow analysis in natural gas and electricity coupled networks. IEEE Trans Power Syst 2012;27:2156-66.
36. Martínez-Mares A, Fuerte-Esquivel C R, de Ingeniería I. Integrated energy flow analysis in natural gas and electricity coupled systems. 2011 North American Power Symposium; 2011 Aug 4-6 Boston, MA, USA: IEEE; 2011. pp. 1-7.
37. Ramsebner J, Haas R, Ajanovic A, Wietschel M. The sector coupling concept: a critical review. WIREs Energy Environ 2021;10.
38. EMA. Gas Network Code. Singapore: Energy Market Authority of Singapore. Availible from: https://www.ema.gov.sg/Gas_Network_Code.aspx [Last accessed on 6 Dec 2021].
39. Grigg C. The IEEE reliability test system 1996. Proceeding of IEEE PES Winter Power Meeting 1996:1010-20.
40. Lin J, Tai K, Tiong RLK, Sim MS. Analyzing impact on critical infrastructure using input-output interdependency model: case studies. ASCE ASME J Risk Uncertain Eng Syst A Civ Eng 2017;3:04017016.
41. Jiwei L, Kang T, Kong RTL, Sim MS. Modelling critical infrastructure network interdependencies and failure. Int J Crit Infrastruct 2019;15:1-23.
42. Lin J, Tai K, Tiong RLK, Sim MS. A general framework for critical infrastructure interdependencies modeling using economic input-output model and network analysis. In: Cardin M, Fong SH, Krob D, Lui PC, Tan YH, editors. Complex Systems Design & Management Asia Cham: Springer International Publishing; 2016. pp. 59-74.
43. Lin J, Tai K, Tiong RLK, Sim MS. Vulnerability analysis for multiple critical infrastructure sectors using interdependencies modeling and network analysis. APSSRA 2016 6th Asian-Pacific Symposium on Structural Reliability and its Applications; 2016 May 28-30 .
44. Mousavi OA, Sanjari MJ, Gharehpetian GB, Naghizadeh R. A simple and unified method to model HVDC links and FACTS devices in DC load flow. Simulation 2009;85:101-9.
45. Yan J, Tang Y, He H, Sun Y. Cascading failure analysis with DC power flow model and transient stability analysis. IEEE Trans Power Syst 2015;30:285-97.
46. Singapore Department of Statistics, Singapore supply, use and input-output tables 2014. Singapore: Singapore Department of Statistics; 2018.
47. Miller RE, Blair PD. Input-output analysis: foundations and extensions. New York: Cambridge University Press; 2009.
Cite This Article
Export citation file: BibTeX | RIS
OAE Style
Lin J, Pan TC. Modelling of multi-sectoral critical infrastructure interdependencies for vulnerability analysis. Dis Prev Res 2022;1:2. http://dx.doi.org/10.20517/dpr.2021.05
AMA Style
Lin J, Pan TC. Modelling of multi-sectoral critical infrastructure interdependencies for vulnerability analysis. Disaster Prevention and Resilience. 2022; 1(1): 2. http://dx.doi.org/10.20517/dpr.2021.05
Chicago/Turabian Style
Lin, Jiwei, Tso-Chien Pan. 2022. "Modelling of multi-sectoral critical infrastructure interdependencies for vulnerability analysis" Disaster Prevention and Resilience. 1, no.1: 2. http://dx.doi.org/10.20517/dpr.2021.05
ACS Style
Lin, J.; Pan T.C. Modelling of multi-sectoral critical infrastructure interdependencies for vulnerability analysis. Dis. Prev. Res. 2022, 1, 2. http://dx.doi.org/10.20517/dpr.2021.05
About This Article
Copyright

Data & Comments
Data


 Cite This Article 24 clicks

 Like This Article 36
likes
Like This Article 36
likes


Comments
Comments must be written in English. Spam, offensive content, impersonation, and private information will not be permitted. If any comment is reported and identified as inappropriate content by OAE staff, the comment will be removed without notice. If you have any queries or need any help, please contact us at support@oaepublish.com.